Immigrants from Sri Lanka vs Yaqui Female Poverty
COMPARE
Immigrants from Sri Lanka
Yaqui
Female Poverty
Female Poverty Comparison
Immigrants from Sri Lanka
Yaqui
12.1%
FEMALE POVERTY
98.5/ 100
METRIC RATING
55th/ 347
METRIC RANK
16.4%
FEMALE POVERTY
0.0/ 100
METRIC RATING
291st/ 347
METRIC RANK
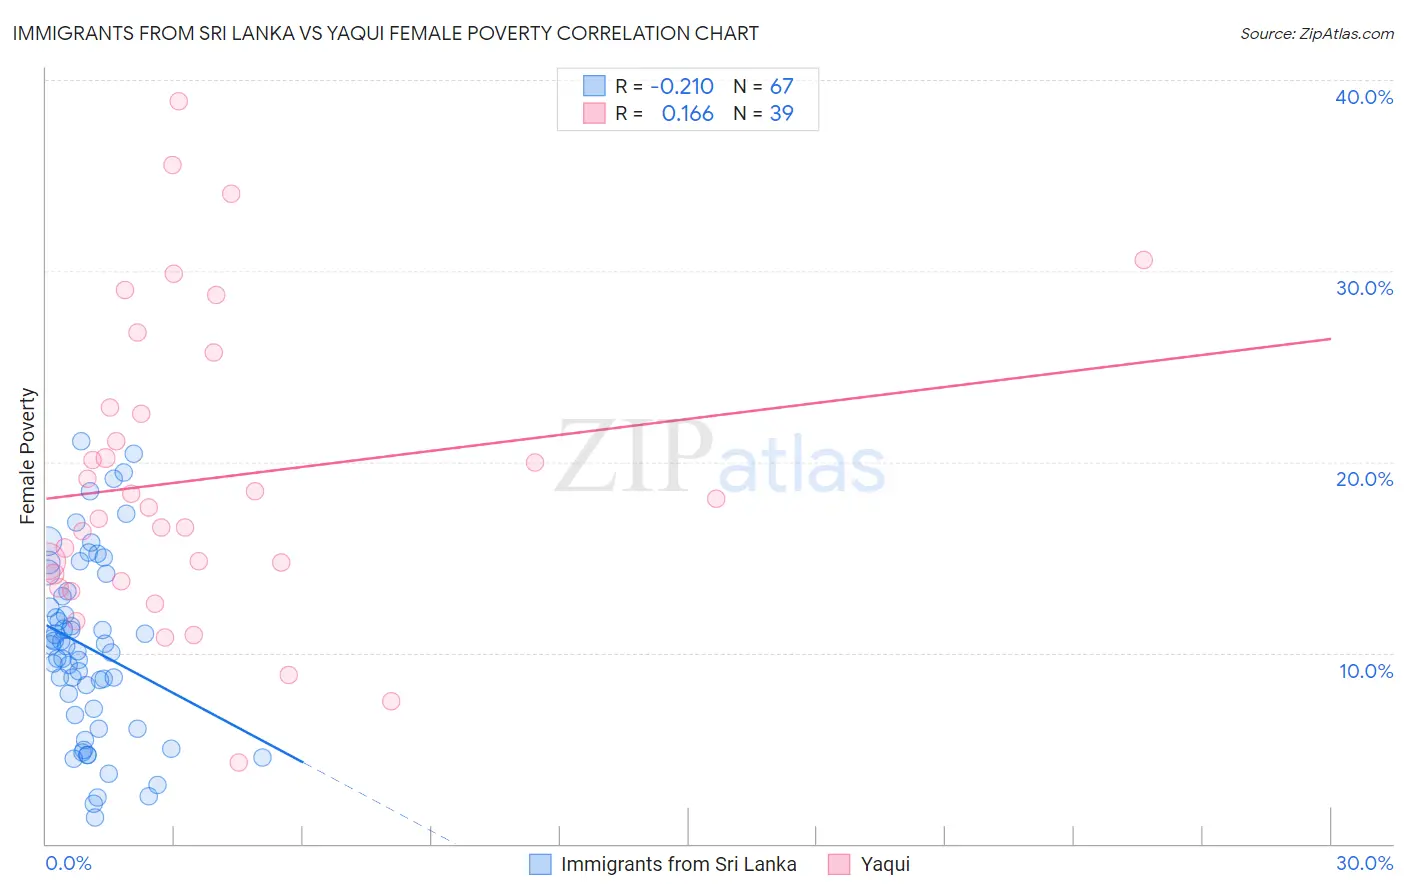
Immigrants from Sri Lanka vs Yaqui Female Poverty Correlation Chart
The statistical analysis conducted on geographies consisting of 149,673,263 people shows a weak negative correlation between the proportion of Immigrants from Sri Lanka and poverty level among females in the United States with a correlation coefficient (R) of -0.210 and weighted average of 12.1%. Similarly, the statistical analysis conducted on geographies consisting of 107,715,533 people shows a poor positive correlation between the proportion of Yaqui and poverty level among females in the United States with a correlation coefficient (R) of 0.166 and weighted average of 16.4%, a difference of 35.8%.
Female Poverty Correlation Summary
| Measurement | Immigrants from Sri Lanka | Yaqui |
| Minimum | 1.4% | 4.2% |
| Maximum | 21.1% | 38.9% |
| Range | 19.7% | 34.7% |
| Mean | 10.3% | 19.1% |
| Median | 10.3% | 17.6% |
| Interquartile 25% (IQ1) | 6.7% | 13.7% |
| Interquartile 75% (IQ3) | 13.2% | 22.9% |
| Interquartile Range (IQR) | 6.5% | 9.1% |
| Standard Deviation (Sample) | 4.7% | 7.9% |
| Standard Deviation (Population) | 4.7% | 7.8% |
Similar Demographics by Female Poverty
Demographics Similar to Immigrants from Sri Lanka by Female Poverty
In terms of female poverty, the demographic groups most similar to Immigrants from Sri Lanka are Estonian (12.1%, a difference of 0.25%), Immigrants from Serbia (12.1%, a difference of 0.31%), Immigrants from Philippines (12.1%, a difference of 0.35%), Scandinavian (12.1%, a difference of 0.39%), and Immigrants from Europe (12.1%, a difference of 0.40%).
| Demographics | Rating | Rank | Female Poverty |
| Immigrants | Japan | 99.0 /100 | #48 | Exceptional 11.9% |
| Immigrants | Romania | 99.0 /100 | #49 | Exceptional 12.0% |
| Slovenes | 98.9 /100 | #50 | Exceptional 12.0% |
| Immigrants | Bulgaria | 98.9 /100 | #51 | Exceptional 12.0% |
| Immigrants | Croatia | 98.7 /100 | #52 | Exceptional 12.0% |
| Immigrants | Austria | 98.7 /100 | #53 | Exceptional 12.0% |
| Immigrants | Philippines | 98.7 /100 | #54 | Exceptional 12.1% |
| Immigrants | Sri Lanka | 98.5 /100 | #55 | Exceptional 12.1% |
| Estonians | 98.3 /100 | #56 | Exceptional 12.1% |
| Immigrants | Serbia | 98.3 /100 | #57 | Exceptional 12.1% |
| Scandinavians | 98.2 /100 | #58 | Exceptional 12.1% |
| Immigrants | Europe | 98.2 /100 | #59 | Exceptional 12.1% |
| Immigrants | Australia | 98.1 /100 | #60 | Exceptional 12.2% |
| Immigrants | Asia | 98.1 /100 | #61 | Exceptional 12.2% |
| Immigrants | Italy | 98.0 /100 | #62 | Exceptional 12.2% |
Demographics Similar to Yaqui by Female Poverty
In terms of female poverty, the demographic groups most similar to Yaqui are Immigrants from Zaire (16.4%, a difference of 0.010%), Immigrants from Latin America (16.4%, a difference of 0.070%), Immigrants from Cabo Verde (16.4%, a difference of 0.10%), Immigrants from Bangladesh (16.4%, a difference of 0.17%), and Senegalese (16.5%, a difference of 0.18%).
| Demographics | Rating | Rank | Female Poverty |
| Spanish Americans | 0.0 /100 | #284 | Tragic 16.2% |
| Comanche | 0.0 /100 | #285 | Tragic 16.2% |
| Inupiat | 0.0 /100 | #286 | Tragic 16.2% |
| Immigrants | Belize | 0.0 /100 | #287 | Tragic 16.3% |
| Indonesians | 0.0 /100 | #288 | Tragic 16.4% |
| Blackfeet | 0.0 /100 | #289 | Tragic 16.4% |
| Immigrants | Bangladesh | 0.0 /100 | #290 | Tragic 16.4% |
| Yaqui | 0.0 /100 | #291 | Tragic 16.4% |
| Immigrants | Zaire | 0.0 /100 | #292 | Tragic 16.4% |
| Immigrants | Latin America | 0.0 /100 | #293 | Tragic 16.4% |
| Immigrants | Cabo Verde | 0.0 /100 | #294 | Tragic 16.4% |
| Senegalese | 0.0 /100 | #295 | Tragic 16.5% |
| Immigrants | Senegal | 0.0 /100 | #296 | Tragic 16.5% |
| Mexicans | 0.0 /100 | #297 | Tragic 16.5% |
| Somalis | 0.0 /100 | #298 | Tragic 16.6% |