Immigrants from Sri Lanka vs Japanese Female Poverty Among 18-24 Year Olds
COMPARE
Immigrants from Sri Lanka
Japanese
Female Poverty Among 18-24 Year Olds
Female Poverty Among 18-24 Year Olds Comparison
Immigrants from Sri Lanka
Japanese
19.2%
FEMALE POVERTY AMONG 18-24 YEAR OLDS
97.5/ 100
METRIC RATING
107th/ 347
METRIC RANK
18.8%
FEMALE POVERTY AMONG 18-24 YEAR OLDS
99.5/ 100
METRIC RATING
81st/ 347
METRIC RANK
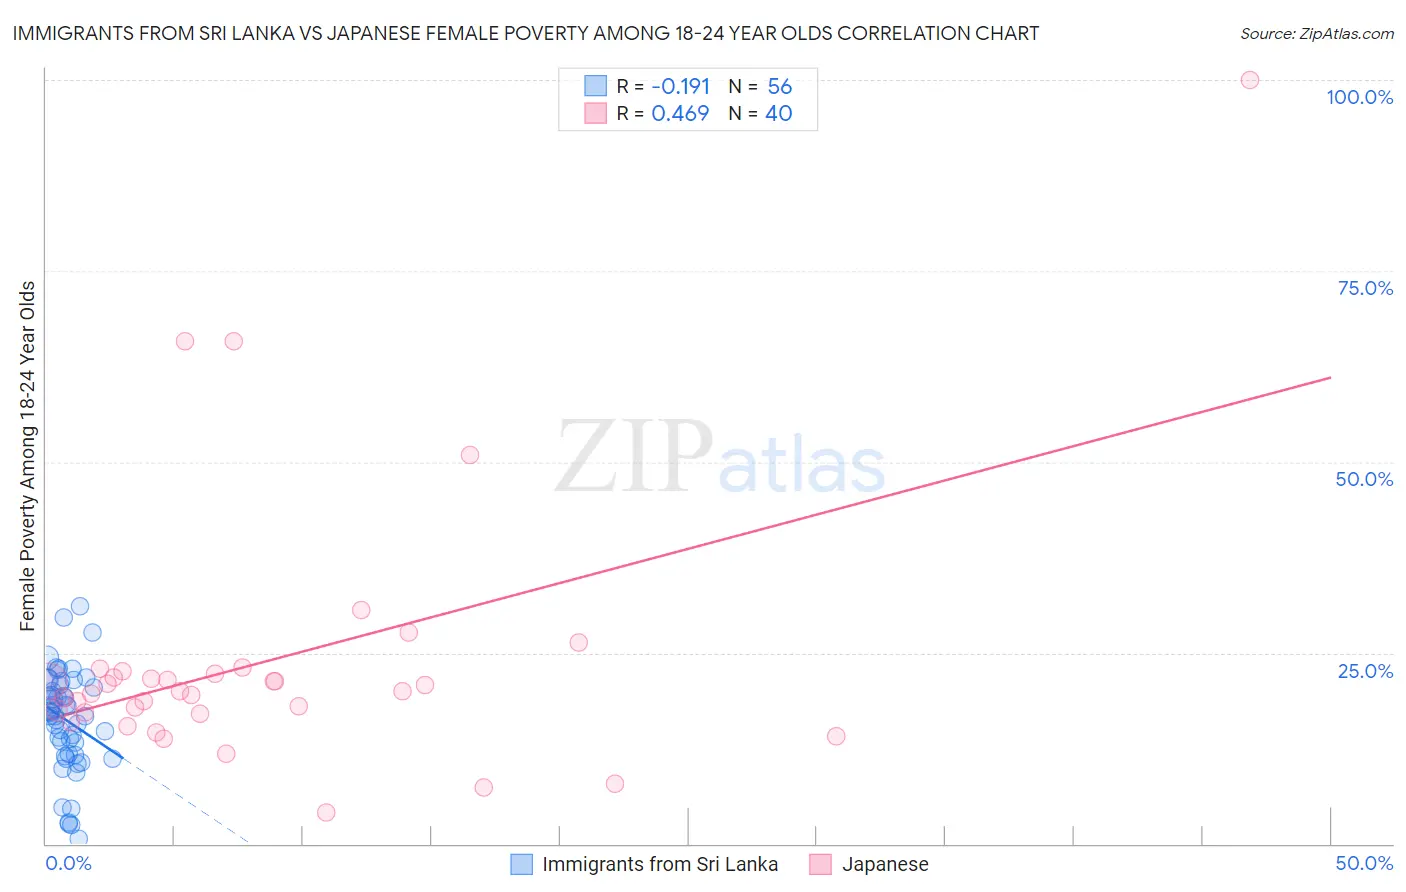
Immigrants from Sri Lanka vs Japanese Female Poverty Among 18-24 Year Olds Correlation Chart
The statistical analysis conducted on geographies consisting of 148,449,032 people shows a poor negative correlation between the proportion of Immigrants from Sri Lanka and poverty level among females between the ages 18 and 24 in the United States with a correlation coefficient (R) of -0.191 and weighted average of 19.2%. Similarly, the statistical analysis conducted on geographies consisting of 246,409,526 people shows a moderate positive correlation between the proportion of Japanese and poverty level among females between the ages 18 and 24 in the United States with a correlation coefficient (R) of 0.469 and weighted average of 18.8%, a difference of 2.0%.
Female Poverty Among 18-24 Year Olds Correlation Summary
| Measurement | Immigrants from Sri Lanka | Japanese |
| Minimum | 0.58% | 4.1% |
| Maximum | 31.0% | 100.0% |
| Range | 30.5% | 95.9% |
| Mean | 16.2% | 23.9% |
| Median | 17.0% | 20.0% |
| Interquartile 25% (IQ1) | 11.7% | 17.1% |
| Interquartile 75% (IQ3) | 20.6% | 22.4% |
| Interquartile Range (IQR) | 8.9% | 5.3% |
| Standard Deviation (Sample) | 6.6% | 17.5% |
| Standard Deviation (Population) | 6.6% | 17.3% |
Similar Demographics by Female Poverty Among 18-24 Year Olds
Demographics Similar to Immigrants from Sri Lanka by Female Poverty Among 18-24 Year Olds
In terms of female poverty among 18-24 year olds, the demographic groups most similar to Immigrants from Sri Lanka are Immigrants from Uzbekistan (19.2%, a difference of 0.090%), Immigrants from Sierra Leone (19.2%, a difference of 0.15%), Immigrants from Syria (19.2%, a difference of 0.17%), Immigrants from Ecuador (19.2%, a difference of 0.19%), and Laotian (19.2%, a difference of 0.20%).
| Demographics | Rating | Rank | Female Poverty Among 18-24 Year Olds |
| Chileans | 98.3 /100 | #100 | Exceptional 19.1% |
| Ecuadorians | 98.1 /100 | #101 | Exceptional 19.1% |
| Immigrants | Caribbean | 98.1 /100 | #102 | Exceptional 19.1% |
| Serbians | 98.0 /100 | #103 | Exceptional 19.1% |
| Immigrants | Afghanistan | 98.0 /100 | #104 | Exceptional 19.1% |
| Immigrants | Ecuador | 97.8 /100 | #105 | Exceptional 19.2% |
| Immigrants | Sierra Leone | 97.8 /100 | #106 | Exceptional 19.2% |
| Immigrants | Sri Lanka | 97.5 /100 | #107 | Exceptional 19.2% |
| Immigrants | Uzbekistan | 97.3 /100 | #108 | Exceptional 19.2% |
| Immigrants | Syria | 97.2 /100 | #109 | Exceptional 19.2% |
| Laotians | 97.1 /100 | #110 | Exceptional 19.2% |
| Immigrants | Serbia | 97.1 /100 | #111 | Exceptional 19.2% |
| Immigrants | El Salvador | 96.5 /100 | #112 | Exceptional 19.3% |
| Immigrants | Cameroon | 96.3 /100 | #113 | Exceptional 19.3% |
| Slovenes | 96.2 /100 | #114 | Exceptional 19.3% |
Demographics Similar to Japanese by Female Poverty Among 18-24 Year Olds
In terms of female poverty among 18-24 year olds, the demographic groups most similar to Japanese are Palestinian (18.8%, a difference of 0.0%), Immigrants from Europe (18.8%, a difference of 0.080%), Uruguayan (18.8%, a difference of 0.080%), Costa Rican (18.8%, a difference of 0.090%), and Immigrants from Uruguay (18.8%, a difference of 0.11%).
| Demographics | Rating | Rank | Female Poverty Among 18-24 Year Olds |
| Hawaiians | 99.6 /100 | #74 | Exceptional 18.7% |
| Poles | 99.6 /100 | #75 | Exceptional 18.8% |
| Immigrants | Cambodia | 99.5 /100 | #76 | Exceptional 18.8% |
| Costa Ricans | 99.5 /100 | #77 | Exceptional 18.8% |
| Immigrants | Europe | 99.5 /100 | #78 | Exceptional 18.8% |
| Uruguayans | 99.5 /100 | #79 | Exceptional 18.8% |
| Palestinians | 99.5 /100 | #80 | Exceptional 18.8% |
| Japanese | 99.5 /100 | #81 | Exceptional 18.8% |
| Immigrants | Uruguay | 99.4 /100 | #82 | Exceptional 18.8% |
| Immigrants | Indonesia | 99.4 /100 | #83 | Exceptional 18.9% |
| Burmese | 99.2 /100 | #84 | Exceptional 18.9% |
| Immigrants | Armenia | 99.2 /100 | #85 | Exceptional 18.9% |
| Immigrants | Iraq | 99.2 /100 | #86 | Exceptional 18.9% |
| Immigrants | Jamaica | 99.2 /100 | #87 | Exceptional 18.9% |
| Croatians | 99.1 /100 | #88 | Exceptional 19.0% |