Immigrants from Spain vs Immigrants from Peru Child Poverty Under the Age of 16
COMPARE
Immigrants from Spain
Immigrants from Peru
Child Poverty Under the Age of 16
Child Poverty Under the Age of 16 Comparison
Immigrants from Spain
Immigrants from Peru
15.3%
CHILD POVERTY UNDER THE AGE OF 16
87.3/ 100
METRIC RATING
136th/ 347
METRIC RANK
15.5%
CHILD POVERTY UNDER THE AGE OF 16
81.7/ 100
METRIC RATING
145th/ 347
METRIC RANK
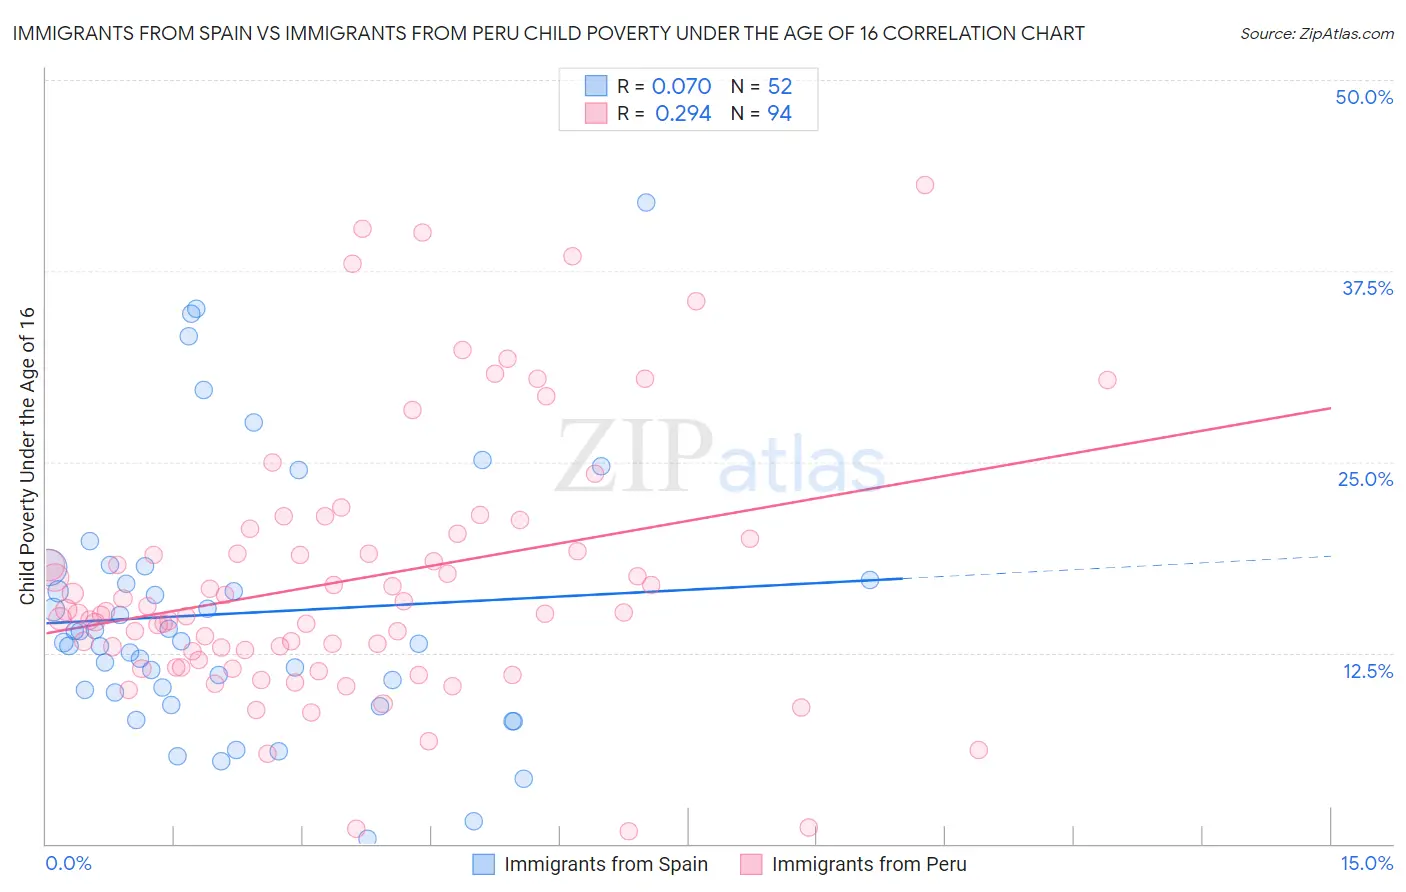
Immigrants from Spain vs Immigrants from Peru Child Poverty Under the Age of 16 Correlation Chart
The statistical analysis conducted on geographies consisting of 238,138,413 people shows a slight positive correlation between the proportion of Immigrants from Spain and poverty level among children under the age of 16 in the United States with a correlation coefficient (R) of 0.070 and weighted average of 15.3%. Similarly, the statistical analysis conducted on geographies consisting of 326,777,909 people shows a weak positive correlation between the proportion of Immigrants from Peru and poverty level among children under the age of 16 in the United States with a correlation coefficient (R) of 0.294 and weighted average of 15.5%, a difference of 1.4%.
Child Poverty Under the Age of 16 Correlation Summary
| Measurement | Immigrants from Spain | Immigrants from Peru |
| Minimum | 0.32% | 0.80% |
| Maximum | 42.0% | 43.1% |
| Range | 41.7% | 42.3% |
| Mean | 15.1% | 17.3% |
| Median | 13.2% | 15.1% |
| Interquartile 25% (IQ1) | 10.0% | 12.0% |
| Interquartile 75% (IQ3) | 17.7% | 20.0% |
| Interquartile Range (IQR) | 7.7% | 8.0% |
| Standard Deviation (Sample) | 8.7% | 8.6% |
| Standard Deviation (Population) | 8.6% | 8.6% |
Demographics Similar to Immigrants from Spain and Immigrants from Peru by Child Poverty Under the Age of 16
In terms of child poverty under the age of 16, the demographic groups most similar to Immigrants from Spain are Peruvian (15.3%, a difference of 0.030%), Welsh (15.3%, a difference of 0.040%), Immigrants from Vietnam (15.3%, a difference of 0.080%), New Zealander (15.3%, a difference of 0.14%), and Albanian (15.2%, a difference of 0.37%). Similarly, the demographic groups most similar to Immigrants from Peru are Slovak (15.5%, a difference of 0.040%), Immigrants from Hungary (15.5%, a difference of 0.050%), Icelander (15.4%, a difference of 0.17%), Brazilian (15.4%, a difference of 0.24%), and Immigrants from Kuwait (15.5%, a difference of 0.24%).
| Demographics | Rating | Rank | Child Poverty Under the Age of 16 |
| Mongolians | 89.5 /100 | #130 | Excellent 15.2% |
| Armenians | 89.4 /100 | #131 | Excellent 15.2% |
| Canadians | 89.1 /100 | #132 | Excellent 15.2% |
| Immigrants | South Eastern Asia | 89.0 /100 | #133 | Excellent 15.2% |
| Native Hawaiians | 88.7 /100 | #134 | Excellent 15.2% |
| Albanians | 88.6 /100 | #135 | Excellent 15.2% |
| Immigrants | Spain | 87.3 /100 | #136 | Excellent 15.3% |
| Peruvians | 87.2 /100 | #137 | Excellent 15.3% |
| Welsh | 87.2 /100 | #138 | Excellent 15.3% |
| Immigrants | Vietnam | 87.1 /100 | #139 | Excellent 15.3% |
| New Zealanders | 86.9 /100 | #140 | Excellent 15.3% |
| Slavs | 84.2 /100 | #141 | Excellent 15.4% |
| Brazilians | 82.8 /100 | #142 | Excellent 15.4% |
| Icelanders | 82.5 /100 | #143 | Excellent 15.4% |
| Immigrants | Hungary | 81.9 /100 | #144 | Excellent 15.5% |
| Immigrants | Peru | 81.7 /100 | #145 | Excellent 15.5% |
| Slovaks | 81.4 /100 | #146 | Excellent 15.5% |
| Immigrants | Kuwait | 80.5 /100 | #147 | Excellent 15.5% |
| Puget Sound Salish | 80.3 /100 | #148 | Excellent 15.5% |
| Israelis | 80.1 /100 | #149 | Excellent 15.5% |
| Immigrants | Jordan | 78.5 /100 | #150 | Good 15.6% |