Immigrants from Spain vs Immigrants from Mexico Female Poverty Among 25-34 Year Olds
COMPARE
Immigrants from Spain
Immigrants from Mexico
Female Poverty Among 25-34 Year Olds
Female Poverty Among 25-34 Year Olds Comparison
Immigrants from Spain
Immigrants from Mexico
12.7%
FEMALE POVERTY AMONG 25-34 YEAR OLDS
95.5/ 100
METRIC RATING
103rd/ 347
METRIC RANK
16.8%
FEMALE POVERTY AMONG 25-34 YEAR OLDS
0.0/ 100
METRIC RATING
303rd/ 347
METRIC RANK
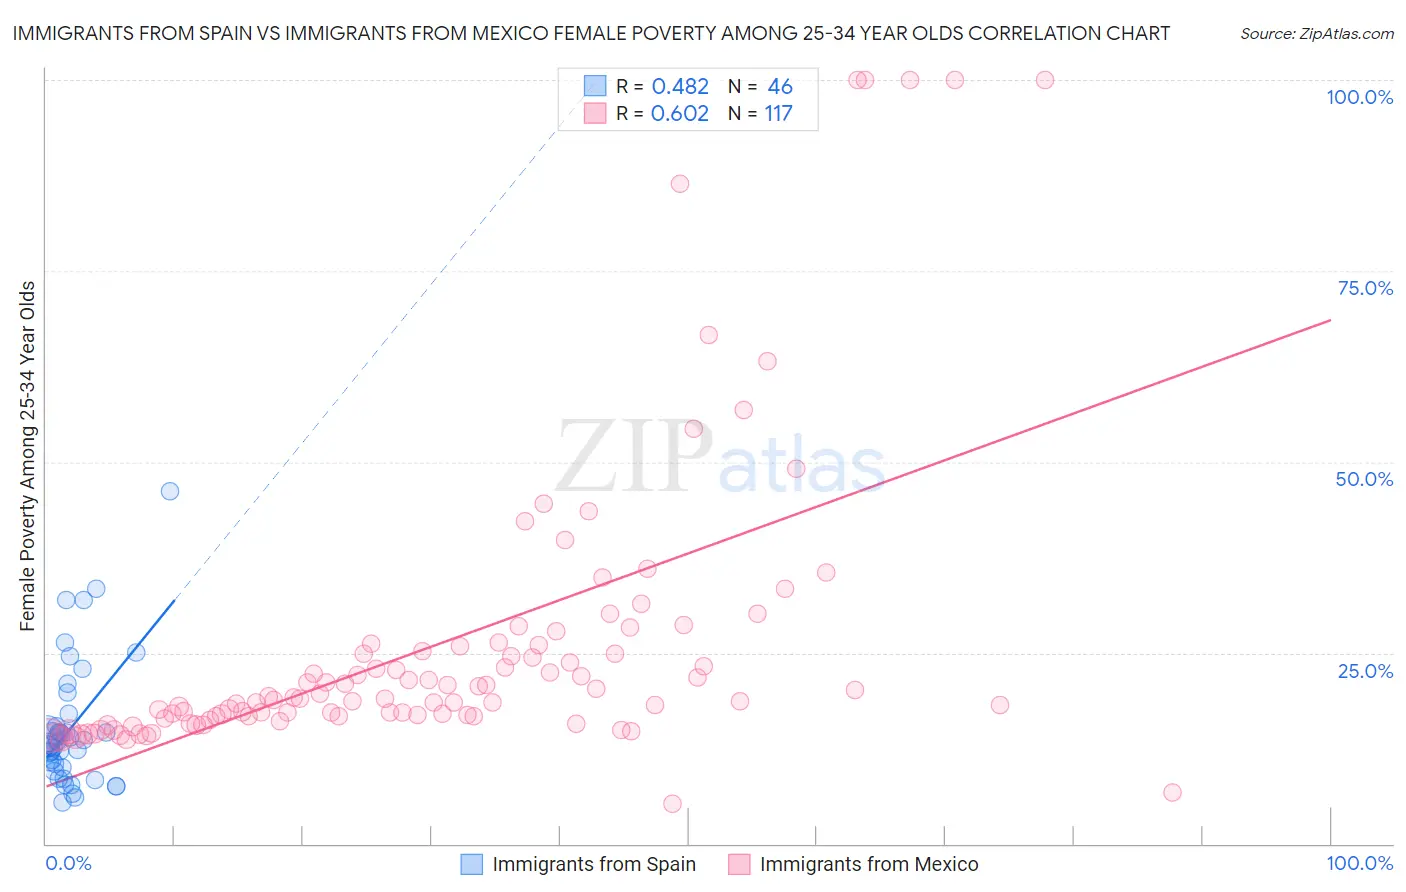
Immigrants from Spain vs Immigrants from Mexico Female Poverty Among 25-34 Year Olds Correlation Chart
The statistical analysis conducted on geographies consisting of 237,358,886 people shows a moderate positive correlation between the proportion of Immigrants from Spain and poverty level among females between the ages 25 and 34 in the United States with a correlation coefficient (R) of 0.482 and weighted average of 12.7%. Similarly, the statistical analysis conducted on geographies consisting of 502,193,205 people shows a significant positive correlation between the proportion of Immigrants from Mexico and poverty level among females between the ages 25 and 34 in the United States with a correlation coefficient (R) of 0.602 and weighted average of 16.8%, a difference of 32.7%.
Female Poverty Among 25-34 Year Olds Correlation Summary
| Measurement | Immigrants from Spain | Immigrants from Mexico |
| Minimum | 5.4% | 5.3% |
| Maximum | 46.2% | 100.0% |
| Range | 40.7% | 94.7% |
| Mean | 15.1% | 26.1% |
| Median | 13.2% | 19.0% |
| Interquartile 25% (IQ1) | 9.9% | 16.7% |
| Interquartile 75% (IQ3) | 15.4% | 25.9% |
| Interquartile Range (IQR) | 5.5% | 9.2% |
| Standard Deviation (Sample) | 8.3% | 19.6% |
| Standard Deviation (Population) | 8.2% | 19.5% |
Similar Demographics by Female Poverty Among 25-34 Year Olds
Demographics Similar to Immigrants from Spain by Female Poverty Among 25-34 Year Olds
In terms of female poverty among 25-34 year olds, the demographic groups most similar to Immigrants from Spain are Swedish (12.7%, a difference of 0.050%), Peruvian (12.7%, a difference of 0.060%), Immigrants from South Africa (12.7%, a difference of 0.090%), Immigrants from Switzerland (12.7%, a difference of 0.12%), and Immigrants from Denmark (12.7%, a difference of 0.14%).
| Demographics | Rating | Rank | Female Poverty Among 25-34 Year Olds |
| Immigrants | Zimbabwe | 96.7 /100 | #96 | Exceptional 12.6% |
| Immigrants | Northern Africa | 96.6 /100 | #97 | Exceptional 12.6% |
| Immigrants | Ethiopia | 96.5 /100 | #98 | Exceptional 12.6% |
| Immigrants | Argentina | 96.4 /100 | #99 | Exceptional 12.6% |
| Immigrants | Denmark | 95.7 /100 | #100 | Exceptional 12.7% |
| Immigrants | Switzerland | 95.7 /100 | #101 | Exceptional 12.7% |
| Peruvians | 95.6 /100 | #102 | Exceptional 12.7% |
| Immigrants | Spain | 95.5 /100 | #103 | Exceptional 12.7% |
| Swedes | 95.4 /100 | #104 | Exceptional 12.7% |
| Immigrants | South Africa | 95.3 /100 | #105 | Exceptional 12.7% |
| Tsimshian | 95.1 /100 | #106 | Exceptional 12.7% |
| Poles | 94.9 /100 | #107 | Exceptional 12.7% |
| Immigrants | Norway | 94.4 /100 | #108 | Exceptional 12.7% |
| Immigrants | Peru | 94.3 /100 | #109 | Exceptional 12.7% |
| Australians | 94.1 /100 | #110 | Exceptional 12.8% |
Demographics Similar to Immigrants from Mexico by Female Poverty Among 25-34 Year Olds
In terms of female poverty among 25-34 year olds, the demographic groups most similar to Immigrants from Mexico are Alaska Native (16.8%, a difference of 0.31%), Honduran (16.9%, a difference of 0.42%), Immigrants from Congo (16.7%, a difference of 0.43%), U.S. Virgin Islander (16.7%, a difference of 0.44%), and Spanish American (16.7%, a difference of 0.58%).
| Demographics | Rating | Rank | Female Poverty Among 25-34 Year Olds |
| Hispanics or Latinos | 0.0 /100 | #296 | Tragic 16.6% |
| Immigrants | Guatemala | 0.0 /100 | #297 | Tragic 16.6% |
| Blackfeet | 0.0 /100 | #298 | Tragic 16.7% |
| Spanish Americans | 0.0 /100 | #299 | Tragic 16.7% |
| U.S. Virgin Islanders | 0.0 /100 | #300 | Tragic 16.7% |
| Immigrants | Congo | 0.0 /100 | #301 | Tragic 16.7% |
| Alaska Natives | 0.0 /100 | #302 | Tragic 16.8% |
| Immigrants | Mexico | 0.0 /100 | #303 | Tragic 16.8% |
| Hondurans | 0.0 /100 | #304 | Tragic 16.9% |
| Immigrants | Cabo Verde | 0.0 /100 | #305 | Tragic 16.9% |
| Chickasaw | 0.0 /100 | #306 | Tragic 17.0% |
| Yaqui | 0.0 /100 | #307 | Tragic 17.0% |
| Africans | 0.0 /100 | #308 | Tragic 17.0% |
| Ottawa | 0.0 /100 | #309 | Tragic 17.1% |
| Cherokee | 0.0 /100 | #310 | Tragic 17.2% |