Immigrants from Spain vs Immigrants from Fiji Female Poverty Among 18-24 Year Olds
COMPARE
Immigrants from Spain
Immigrants from Fiji
Female Poverty Among 18-24 Year Olds
Female Poverty Among 18-24 Year Olds Comparison
Immigrants from Spain
Immigrants from Fiji
20.4%
FEMALE POVERTY AMONG 18-24 YEAR OLDS
20.7/ 100
METRIC RATING
198th/ 347
METRIC RANK
17.7%
FEMALE POVERTY AMONG 18-24 YEAR OLDS
100.0/ 100
METRIC RATING
26th/ 347
METRIC RANK
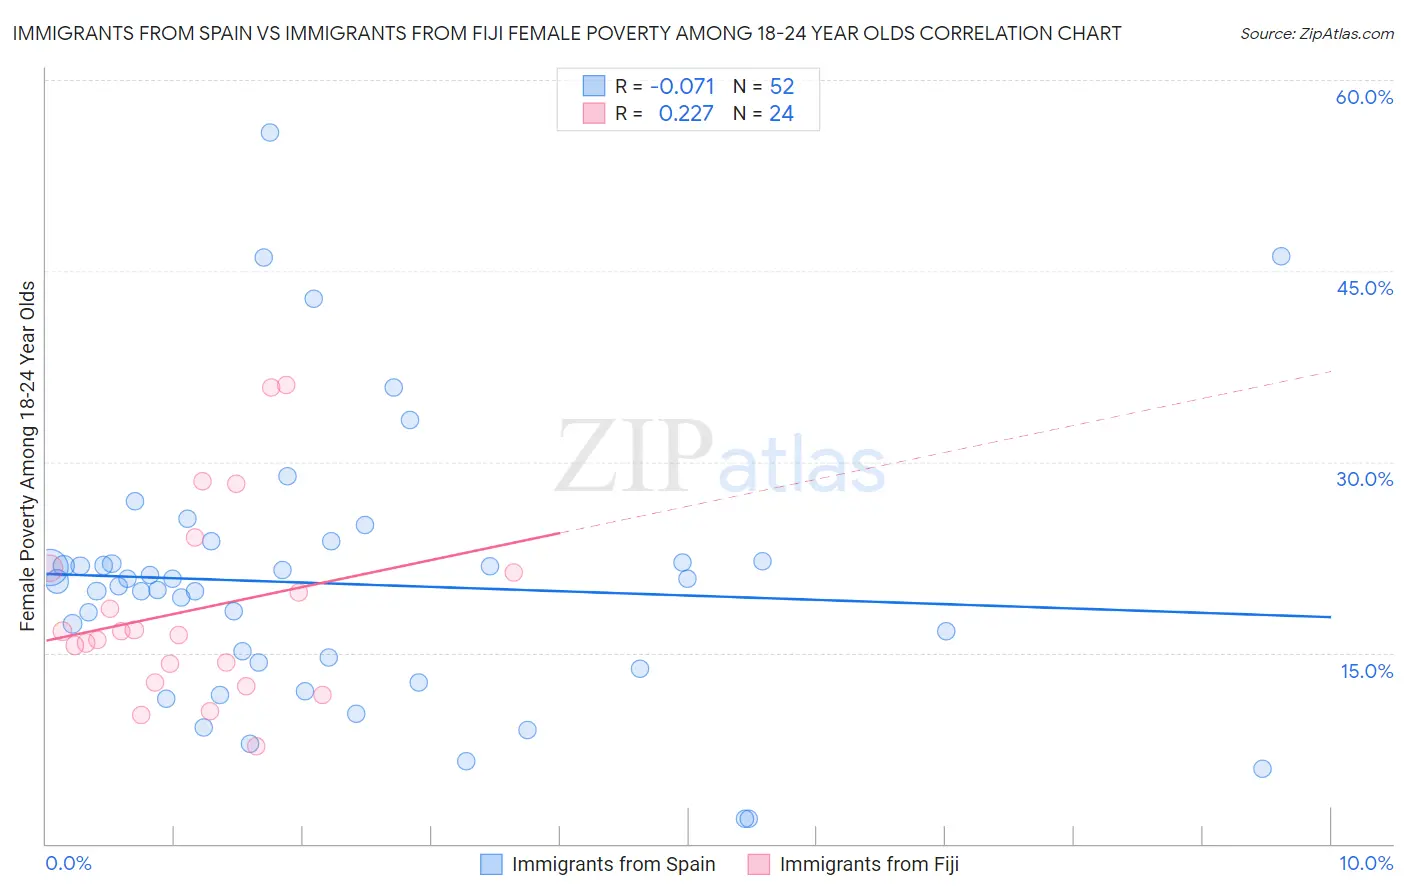
Immigrants from Spain vs Immigrants from Fiji Female Poverty Among 18-24 Year Olds Correlation Chart
The statistical analysis conducted on geographies consisting of 236,171,622 people shows a slight negative correlation between the proportion of Immigrants from Spain and poverty level among females between the ages 18 and 24 in the United States with a correlation coefficient (R) of -0.071 and weighted average of 20.4%. Similarly, the statistical analysis conducted on geographies consisting of 93,267,707 people shows a weak positive correlation between the proportion of Immigrants from Fiji and poverty level among females between the ages 18 and 24 in the United States with a correlation coefficient (R) of 0.227 and weighted average of 17.7%, a difference of 15.8%.
Female Poverty Among 18-24 Year Olds Correlation Summary
| Measurement | Immigrants from Spain | Immigrants from Fiji |
| Minimum | 2.0% | 7.6% |
| Maximum | 55.9% | 36.1% |
| Range | 53.9% | 28.5% |
| Mean | 20.4% | 18.4% |
| Median | 20.4% | 16.5% |
| Interquartile 25% (IQ1) | 14.0% | 13.4% |
| Interquartile 75% (IQ3) | 22.2% | 21.5% |
| Interquartile Range (IQR) | 8.1% | 8.1% |
| Standard Deviation (Sample) | 10.6% | 7.5% |
| Standard Deviation (Population) | 10.5% | 7.4% |
Similar Demographics by Female Poverty Among 18-24 Year Olds
Demographics Similar to Immigrants from Spain by Female Poverty Among 18-24 Year Olds
In terms of female poverty among 18-24 year olds, the demographic groups most similar to Immigrants from Spain are German (20.4%, a difference of 0.010%), Zimbabwean (20.4%, a difference of 0.020%), European (20.4%, a difference of 0.060%), Czech (20.4%, a difference of 0.12%), and Immigrants from Latvia (20.4%, a difference of 0.16%).
| Demographics | Rating | Rank | Female Poverty Among 18-24 Year Olds |
| Moroccans | 25.8 /100 | #191 | Fair 20.4% |
| Immigrants | Israel | 24.4 /100 | #192 | Fair 20.4% |
| Nigerians | 23.4 /100 | #193 | Fair 20.4% |
| Mexican American Indians | 23.2 /100 | #194 | Fair 20.4% |
| Immigrants | Latvia | 23.0 /100 | #195 | Fair 20.4% |
| Czechs | 22.3 /100 | #196 | Fair 20.4% |
| Zimbabweans | 21.0 /100 | #197 | Fair 20.4% |
| Immigrants | Spain | 20.7 /100 | #198 | Fair 20.4% |
| Germans | 20.6 /100 | #199 | Fair 20.4% |
| Europeans | 19.9 /100 | #200 | Poor 20.4% |
| Mexicans | 18.3 /100 | #201 | Poor 20.5% |
| Immigrants | Turkey | 17.7 /100 | #202 | Poor 20.5% |
| Immigrants | Malaysia | 17.2 /100 | #203 | Poor 20.5% |
| Immigrants | Netherlands | 17.0 /100 | #204 | Poor 20.5% |
| English | 16.7 /100 | #205 | Poor 20.5% |
Demographics Similar to Immigrants from Fiji by Female Poverty Among 18-24 Year Olds
In terms of female poverty among 18-24 year olds, the demographic groups most similar to Immigrants from Fiji are Colombian (17.7%, a difference of 0.11%), Venezuelan (17.7%, a difference of 0.24%), Immigrants from South Central Asia (17.6%, a difference of 0.33%), Maltese (17.6%, a difference of 0.51%), and Immigrants from North Macedonia (17.6%, a difference of 0.57%).
| Demographics | Rating | Rank | Female Poverty Among 18-24 Year Olds |
| Immigrants | Lithuania | 100.0 /100 | #19 | Exceptional 17.4% |
| Immigrants | Venezuela | 100.0 /100 | #20 | Exceptional 17.4% |
| Bolivians | 100.0 /100 | #21 | Exceptional 17.4% |
| Immigrants | Hong Kong | 100.0 /100 | #22 | Exceptional 17.5% |
| Immigrants | North Macedonia | 100.0 /100 | #23 | Exceptional 17.6% |
| Maltese | 100.0 /100 | #24 | Exceptional 17.6% |
| Immigrants | South Central Asia | 100.0 /100 | #25 | Exceptional 17.6% |
| Immigrants | Fiji | 100.0 /100 | #26 | Exceptional 17.7% |
| Colombians | 100.0 /100 | #27 | Exceptional 17.7% |
| Venezuelans | 100.0 /100 | #28 | Exceptional 17.7% |
| Portuguese | 100.0 /100 | #29 | Exceptional 17.8% |
| Immigrants | South Eastern Asia | 100.0 /100 | #30 | Exceptional 17.8% |
| Immigrants | Vietnam | 100.0 /100 | #31 | Exceptional 17.8% |
| Immigrants | Moldova | 100.0 /100 | #32 | Exceptional 17.9% |
| Native Hawaiians | 100.0 /100 | #33 | Exceptional 17.9% |