Immigrants from Spain vs Houma Female Poverty
COMPARE
Immigrants from Spain
Houma
Female Poverty
Female Poverty Comparison
Immigrants from Spain
Houma
13.4%
FEMALE POVERTY
49.9/ 100
METRIC RATING
176th/ 347
METRIC RANK
20.0%
FEMALE POVERTY
0.0/ 100
METRIC RATING
334th/ 347
METRIC RANK
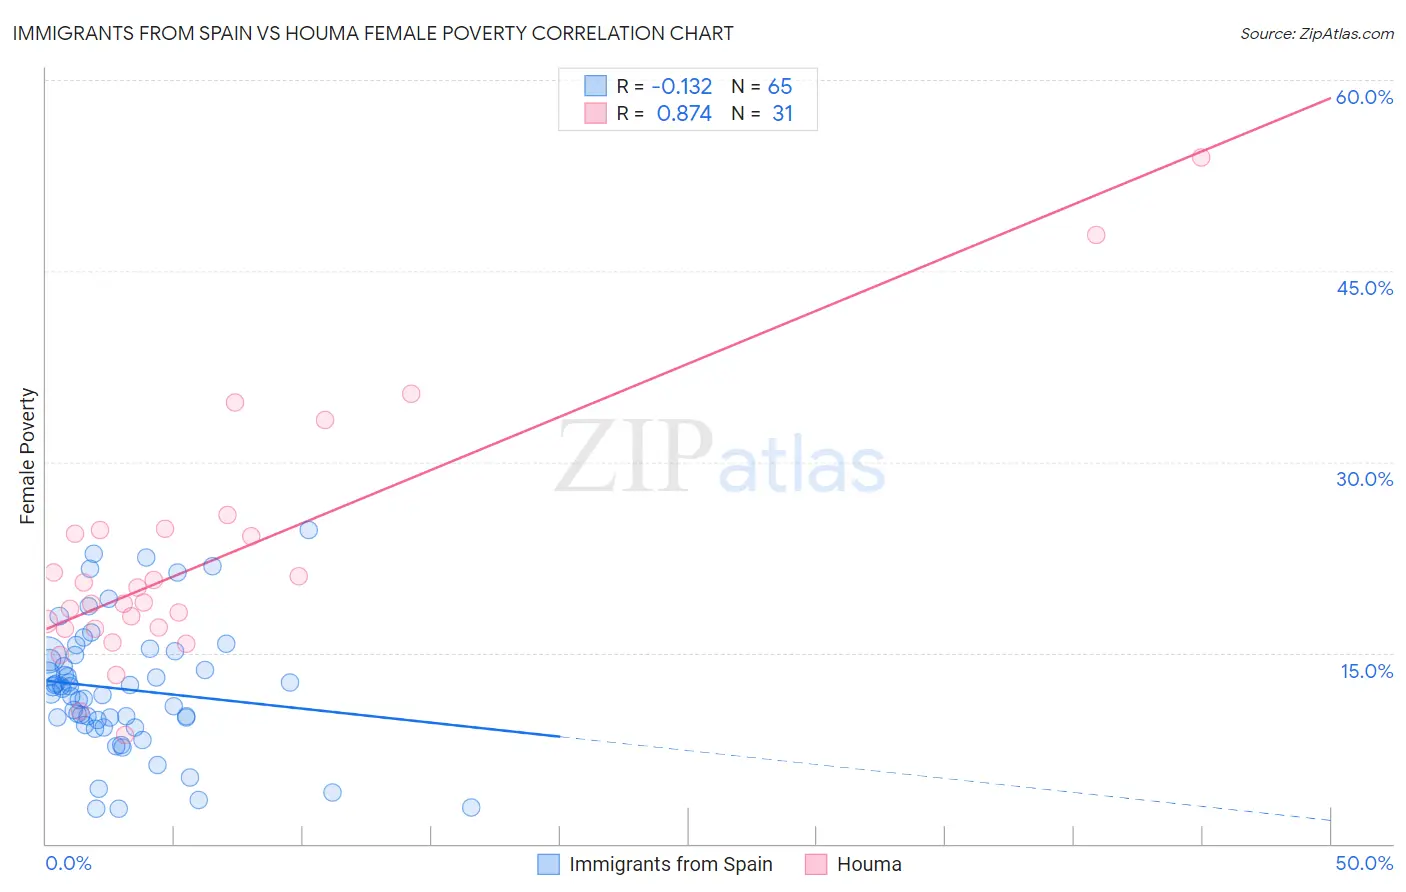
Immigrants from Spain vs Houma Female Poverty Correlation Chart
The statistical analysis conducted on geographies consisting of 239,582,161 people shows a poor negative correlation between the proportion of Immigrants from Spain and poverty level among females in the United States with a correlation coefficient (R) of -0.132 and weighted average of 13.4%. Similarly, the statistical analysis conducted on geographies consisting of 36,796,778 people shows a very strong positive correlation between the proportion of Houma and poverty level among females in the United States with a correlation coefficient (R) of 0.874 and weighted average of 20.0%, a difference of 49.1%.
Female Poverty Correlation Summary
| Measurement | Immigrants from Spain | Houma |
| Minimum | 2.7% | 8.5% |
| Maximum | 24.6% | 53.9% |
| Range | 21.9% | 45.4% |
| Mean | 12.1% | 22.3% |
| Median | 12.2% | 19.0% |
| Interquartile 25% (IQ1) | 9.6% | 16.9% |
| Interquartile 75% (IQ3) | 14.8% | 24.6% |
| Interquartile Range (IQR) | 5.3% | 7.7% |
| Standard Deviation (Sample) | 5.0% | 9.8% |
| Standard Deviation (Population) | 4.9% | 9.7% |
Similar Demographics by Female Poverty
Demographics Similar to Immigrants from Spain by Female Poverty
In terms of female poverty, the demographic groups most similar to Immigrants from Spain are Celtic (13.4%, a difference of 0.0%), Immigrants from Iraq (13.4%, a difference of 0.010%), Immigrants from Morocco (13.4%, a difference of 0.040%), Israeli (13.5%, a difference of 0.080%), and Immigrants from Afghanistan (13.4%, a difference of 0.090%).
| Demographics | Rating | Rank | Female Poverty |
| Lebanese | 55.9 /100 | #169 | Average 13.4% |
| Colombians | 55.7 /100 | #170 | Average 13.4% |
| Whites/Caucasians | 54.6 /100 | #171 | Average 13.4% |
| Mongolians | 53.6 /100 | #172 | Average 13.4% |
| Immigrants | Afghanistan | 50.8 /100 | #173 | Average 13.4% |
| Immigrants | Iraq | 50.0 /100 | #174 | Average 13.4% |
| Celtics | 49.9 /100 | #175 | Average 13.4% |
| Immigrants | Spain | 49.9 /100 | #176 | Average 13.4% |
| Immigrants | Morocco | 49.4 /100 | #177 | Average 13.4% |
| Israelis | 49.1 /100 | #178 | Average 13.5% |
| Immigrants | Syria | 48.8 /100 | #179 | Average 13.5% |
| South Americans | 44.8 /100 | #180 | Average 13.5% |
| Venezuelans | 44.5 /100 | #181 | Average 13.5% |
| Immigrants | Colombia | 44.5 /100 | #182 | Average 13.5% |
| Kenyans | 43.8 /100 | #183 | Average 13.5% |
Demographics Similar to Houma by Female Poverty
In terms of female poverty, the demographic groups most similar to Houma are Cheyenne (20.2%, a difference of 0.77%), Pueblo (20.7%, a difference of 3.2%), Immigrants from Dominican Republic (19.3%, a difference of 3.6%), Yuman (20.8%, a difference of 4.0%), and Apache (19.2%, a difference of 4.2%).
| Demographics | Rating | Rank | Female Poverty |
| Yakama | 0.0 /100 | #327 | Tragic 18.0% |
| Blacks/African Americans | 0.0 /100 | #328 | Tragic 18.6% |
| Kiowa | 0.0 /100 | #329 | Tragic 18.6% |
| Dominicans | 0.0 /100 | #330 | Tragic 19.1% |
| Natives/Alaskans | 0.0 /100 | #331 | Tragic 19.2% |
| Apache | 0.0 /100 | #332 | Tragic 19.2% |
| Immigrants | Dominican Republic | 0.0 /100 | #333 | Tragic 19.3% |
| Houma | 0.0 /100 | #334 | Tragic 20.0% |
| Cheyenne | 0.0 /100 | #335 | Tragic 20.2% |
| Pueblo | 0.0 /100 | #336 | Tragic 20.7% |
| Yuman | 0.0 /100 | #337 | Tragic 20.8% |
| Sioux | 0.0 /100 | #338 | Tragic 20.9% |
| Hopi | 0.0 /100 | #339 | Tragic 21.0% |
| Yup'ik | 0.0 /100 | #340 | Tragic 21.5% |
| Crow | 0.0 /100 | #341 | Tragic 22.1% |