Immigrants from Spain vs Armenian Single Father Poverty
COMPARE
Immigrants from Spain
Armenian
Single Father Poverty
Single Father Poverty Comparison
Immigrants from Spain
Armenians
16.7%
SINGLE FATHER POVERTY
8.0/ 100
METRIC RATING
222nd/ 347
METRIC RANK
15.4%
SINGLE FATHER POVERTY
99.4/ 100
METRIC RATING
80th/ 347
METRIC RANK
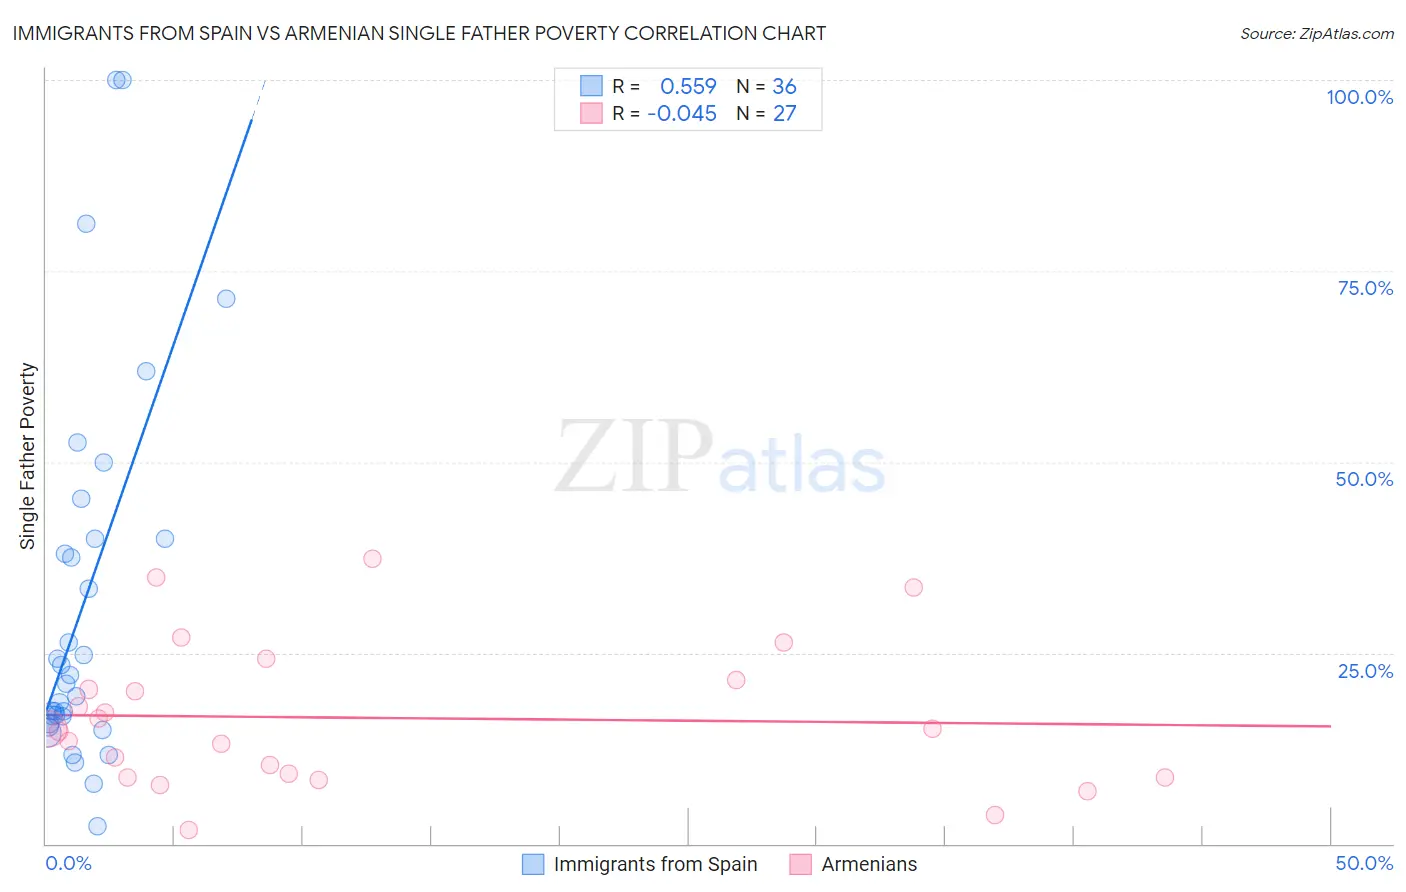
Immigrants from Spain vs Armenian Single Father Poverty Correlation Chart
The statistical analysis conducted on geographies consisting of 200,148,614 people shows a substantial positive correlation between the proportion of Immigrants from Spain and poverty level among single fathers in the United States with a correlation coefficient (R) of 0.559 and weighted average of 16.7%. Similarly, the statistical analysis conducted on geographies consisting of 247,264,844 people shows no correlation between the proportion of Armenians and poverty level among single fathers in the United States with a correlation coefficient (R) of -0.045 and weighted average of 15.4%, a difference of 8.8%.
Single Father Poverty Correlation Summary
| Measurement | Immigrants from Spain | Armenian |
| Minimum | 2.2% | 1.9% |
| Maximum | 100.0% | 37.4% |
| Range | 97.8% | 35.5% |
| Mean | 31.6% | 16.5% |
| Median | 21.5% | 15.1% |
| Interquartile 25% (IQ1) | 16.2% | 8.7% |
| Interquartile 75% (IQ3) | 40.0% | 21.4% |
| Interquartile Range (IQR) | 23.8% | 12.8% |
| Standard Deviation (Sample) | 24.6% | 9.3% |
| Standard Deviation (Population) | 24.3% | 9.2% |
Similar Demographics by Single Father Poverty
Demographics Similar to Immigrants from Spain by Single Father Poverty
In terms of single father poverty, the demographic groups most similar to Immigrants from Spain are Immigrants from Denmark (16.7%, a difference of 0.010%), Immigrants from Greece (16.7%, a difference of 0.010%), Immigrants from Ghana (16.7%, a difference of 0.020%), Immigrants from Uganda (16.7%, a difference of 0.070%), and Immigrants from Austria (16.8%, a difference of 0.16%).
| Demographics | Rating | Rank | Single Father Poverty |
| Immigrants | Scotland | 9.6 /100 | #215 | Tragic 16.7% |
| Immigrants | England | 9.5 /100 | #216 | Tragic 16.7% |
| Cheyenne | 9.3 /100 | #217 | Tragic 16.7% |
| Immigrants | Uganda | 8.6 /100 | #218 | Tragic 16.7% |
| Immigrants | Ghana | 8.1 /100 | #219 | Tragic 16.7% |
| Immigrants | Denmark | 8.1 /100 | #220 | Tragic 16.7% |
| Immigrants | Greece | 8.1 /100 | #221 | Tragic 16.7% |
| Immigrants | Spain | 8.0 /100 | #222 | Tragic 16.7% |
| Immigrants | Austria | 7.0 /100 | #223 | Tragic 16.8% |
| Immigrants | Norway | 6.5 /100 | #224 | Tragic 16.8% |
| Menominee | 6.4 /100 | #225 | Tragic 16.8% |
| Hispanics or Latinos | 6.1 /100 | #226 | Tragic 16.8% |
| British | 5.6 /100 | #227 | Tragic 16.8% |
| Belgians | 5.3 /100 | #228 | Tragic 16.8% |
| Israelis | 4.6 /100 | #229 | Tragic 16.8% |
Demographics Similar to Armenians by Single Father Poverty
In terms of single father poverty, the demographic groups most similar to Armenians are Immigrants from Congo (15.4%, a difference of 0.020%), Immigrants from Ukraine (15.4%, a difference of 0.030%), Chinese (15.4%, a difference of 0.12%), Immigrants from Northern Africa (15.3%, a difference of 0.23%), and Tlingit-Haida (15.3%, a difference of 0.25%).
| Demographics | Rating | Rank | Single Father Poverty |
| Kenyans | 99.6 /100 | #73 | Exceptional 15.3% |
| Maltese | 99.6 /100 | #74 | Exceptional 15.3% |
| Immigrants | Turkey | 99.5 /100 | #75 | Exceptional 15.3% |
| Immigrants | Japan | 99.5 /100 | #76 | Exceptional 15.3% |
| Immigrants | Peru | 99.5 /100 | #77 | Exceptional 15.3% |
| Tlingit-Haida | 99.5 /100 | #78 | Exceptional 15.3% |
| Immigrants | Northern Africa | 99.5 /100 | #79 | Exceptional 15.3% |
| Armenians | 99.4 /100 | #80 | Exceptional 15.4% |
| Immigrants | Congo | 99.4 /100 | #81 | Exceptional 15.4% |
| Immigrants | Ukraine | 99.4 /100 | #82 | Exceptional 15.4% |
| Chinese | 99.3 /100 | #83 | Exceptional 15.4% |
| Peruvians | 99.2 /100 | #84 | Exceptional 15.4% |
| Immigrants | Oceania | 99.1 /100 | #85 | Exceptional 15.4% |
| Immigrants | Russia | 99.0 /100 | #86 | Exceptional 15.5% |
| Brazilians | 99.0 /100 | #87 | Exceptional 15.5% |