Immigrants from Southern Europe vs Panamanian Single Father Poverty
COMPARE
Immigrants from Southern Europe
Panamanian
Single Father Poverty
Single Father Poverty Comparison
Immigrants from Southern Europe
Panamanians
16.7%
SINGLE FATHER POVERTY
11.2/ 100
METRIC RATING
212th/ 347
METRIC RANK
16.4%
SINGLE FATHER POVERTY
33.6/ 100
METRIC RATING
185th/ 347
METRIC RANK
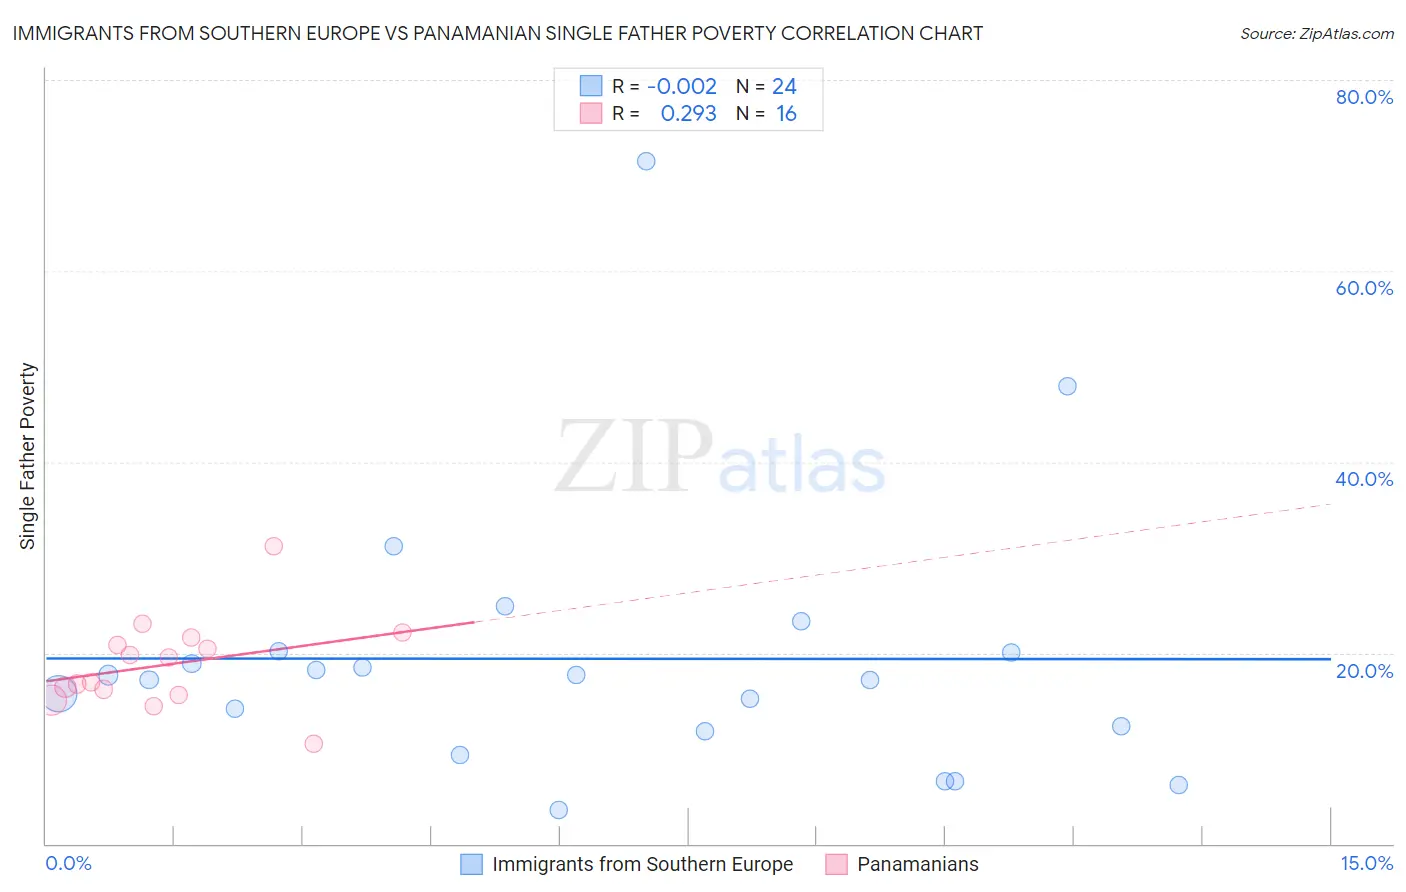
Immigrants from Southern Europe vs Panamanian Single Father Poverty Correlation Chart
The statistical analysis conducted on geographies consisting of 311,843,806 people shows no correlation between the proportion of Immigrants from Southern Europe and poverty level among single fathers in the United States with a correlation coefficient (R) of -0.002 and weighted average of 16.7%. Similarly, the statistical analysis conducted on geographies consisting of 236,933,167 people shows a weak positive correlation between the proportion of Panamanians and poverty level among single fathers in the United States with a correlation coefficient (R) of 0.293 and weighted average of 16.4%, a difference of 1.5%.
Single Father Poverty Correlation Summary
| Measurement | Immigrants from Southern Europe | Panamanian |
| Minimum | 3.6% | 10.4% |
| Maximum | 71.4% | 31.2% |
| Range | 67.9% | 20.8% |
| Mean | 19.4% | 18.8% |
| Median | 17.4% | 18.2% |
| Interquartile 25% (IQ1) | 12.0% | 15.9% |
| Interquartile 75% (IQ3) | 20.1% | 21.2% |
| Interquartile Range (IQR) | 8.1% | 5.3% |
| Standard Deviation (Sample) | 14.4% | 4.7% |
| Standard Deviation (Population) | 14.1% | 4.6% |
Similar Demographics by Single Father Poverty
Demographics Similar to Immigrants from Southern Europe by Single Father Poverty
In terms of single father poverty, the demographic groups most similar to Immigrants from Southern Europe are Ghanaian (16.7%, a difference of 0.020%), Spanish (16.7%, a difference of 0.050%), Arab (16.6%, a difference of 0.17%), Guatemalan (16.6%, a difference of 0.18%), and Immigrants from Scotland (16.7%, a difference of 0.19%).
| Demographics | Rating | Rank | Single Father Poverty |
| Venezuelans | 14.3 /100 | #205 | Poor 16.6% |
| Immigrants | Senegal | 13.7 /100 | #206 | Poor 16.6% |
| New Zealanders | 13.7 /100 | #207 | Poor 16.6% |
| Eastern Europeans | 13.7 /100 | #208 | Poor 16.6% |
| Europeans | 13.2 /100 | #209 | Poor 16.6% |
| Guatemalans | 12.9 /100 | #210 | Poor 16.6% |
| Arabs | 12.8 /100 | #211 | Poor 16.6% |
| Immigrants | Southern Europe | 11.2 /100 | #212 | Poor 16.7% |
| Ghanaians | 11.0 /100 | #213 | Poor 16.7% |
| Spanish | 10.7 /100 | #214 | Poor 16.7% |
| Immigrants | Scotland | 9.6 /100 | #215 | Tragic 16.7% |
| Immigrants | England | 9.5 /100 | #216 | Tragic 16.7% |
| Cheyenne | 9.3 /100 | #217 | Tragic 16.7% |
| Immigrants | Uganda | 8.6 /100 | #218 | Tragic 16.7% |
| Immigrants | Ghana | 8.1 /100 | #219 | Tragic 16.7% |
Demographics Similar to Panamanians by Single Father Poverty
In terms of single father poverty, the demographic groups most similar to Panamanians are Cambodian (16.4%, a difference of 0.050%), Aleut (16.4%, a difference of 0.080%), Immigrants from Italy (16.4%, a difference of 0.11%), Immigrants from Western Africa (16.4%, a difference of 0.12%), and Immigrants from Venezuela (16.4%, a difference of 0.13%).
| Demographics | Rating | Rank | Single Father Poverty |
| Immigrants | Cuba | 41.6 /100 | #178 | Average 16.4% |
| Serbians | 40.9 /100 | #179 | Average 16.4% |
| Immigrants | Latin America | 37.2 /100 | #180 | Fair 16.4% |
| Immigrants | Western Africa | 36.0 /100 | #181 | Fair 16.4% |
| Immigrants | Italy | 35.7 /100 | #182 | Fair 16.4% |
| Aleuts | 35.3 /100 | #183 | Fair 16.4% |
| Cambodians | 34.6 /100 | #184 | Fair 16.4% |
| Panamanians | 33.6 /100 | #185 | Fair 16.4% |
| Immigrants | Venezuela | 31.0 /100 | #186 | Fair 16.4% |
| Ukrainians | 30.4 /100 | #187 | Fair 16.4% |
| Russians | 30.1 /100 | #188 | Fair 16.4% |
| Latvians | 28.9 /100 | #189 | Fair 16.5% |
| Immigrants | Burma/Myanmar | 28.0 /100 | #190 | Fair 16.5% |
| Immigrants | Guyana | 27.1 /100 | #191 | Fair 16.5% |
| Immigrants | Switzerland | 24.8 /100 | #192 | Fair 16.5% |