Immigrants from Southern Europe vs Immigrants from Yemen Poverty
COMPARE
Immigrants from Southern Europe
Immigrants from Yemen
Poverty
Poverty Comparison
Immigrants from Southern Europe
Immigrants from Yemen
11.6%
POVERTY
90.8/ 100
METRIC RATING
112th/ 347
METRIC RANK
21.5%
POVERTY
0.0/ 100
METRIC RATING
342nd/ 347
METRIC RANK
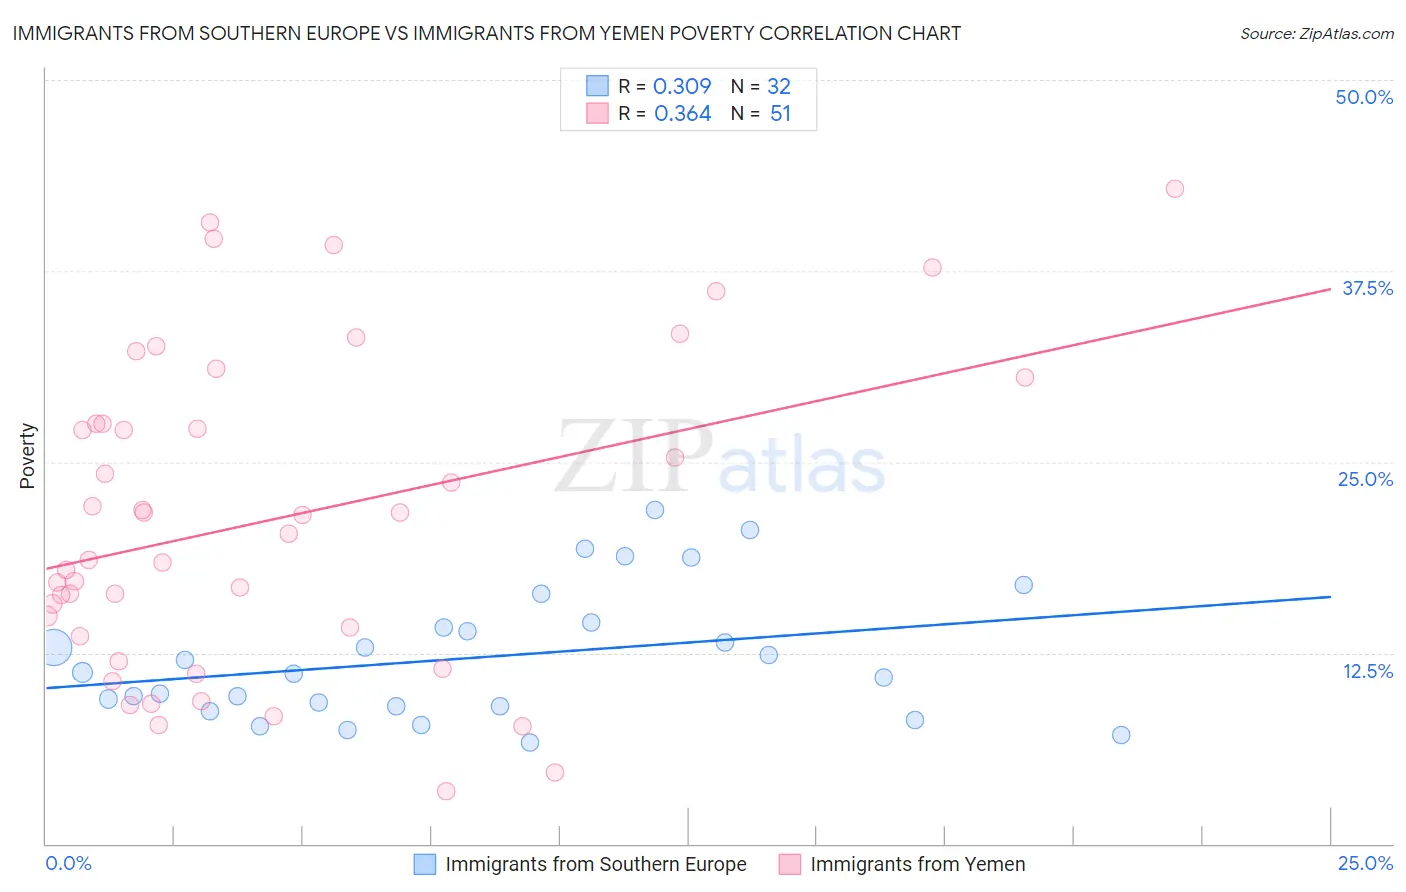
Immigrants from Southern Europe vs Immigrants from Yemen Poverty Correlation Chart
The statistical analysis conducted on geographies consisting of 402,613,085 people shows a mild positive correlation between the proportion of Immigrants from Southern Europe and poverty level in the United States with a correlation coefficient (R) of 0.309 and weighted average of 11.6%. Similarly, the statistical analysis conducted on geographies consisting of 82,433,611 people shows a mild positive correlation between the proportion of Immigrants from Yemen and poverty level in the United States with a correlation coefficient (R) of 0.364 and weighted average of 21.5%, a difference of 84.9%.
Poverty Correlation Summary
| Measurement | Immigrants from Southern Europe | Immigrants from Yemen |
| Minimum | 6.6% | 3.5% |
| Maximum | 21.8% | 42.9% |
| Range | 15.2% | 39.4% |
| Mean | 12.2% | 21.3% |
| Median | 11.2% | 20.3% |
| Interquartile 25% (IQ1) | 9.0% | 13.6% |
| Interquartile 75% (IQ3) | 14.3% | 27.5% |
| Interquartile Range (IQR) | 5.3% | 13.9% |
| Standard Deviation (Sample) | 4.3% | 10.2% |
| Standard Deviation (Population) | 4.2% | 10.1% |
Similar Demographics by Poverty
Demographics Similar to Immigrants from Southern Europe by Poverty
In terms of poverty, the demographic groups most similar to Immigrants from Southern Europe are Immigrants from Belarus (11.6%, a difference of 0.0%), Immigrants from China (11.6%, a difference of 0.020%), French Canadian (11.6%, a difference of 0.070%), Albanian (11.7%, a difference of 0.16%), and Welsh (11.6%, a difference of 0.23%).
| Demographics | Rating | Rank | Poverty |
| Portuguese | 92.1 /100 | #105 | Exceptional 11.6% |
| Immigrants | Zimbabwe | 92.1 /100 | #106 | Exceptional 11.6% |
| Palestinians | 91.8 /100 | #107 | Exceptional 11.6% |
| Canadians | 91.7 /100 | #108 | Exceptional 11.6% |
| Immigrants | Turkey | 91.7 /100 | #109 | Exceptional 11.6% |
| Welsh | 91.6 /100 | #110 | Exceptional 11.6% |
| French Canadians | 91.0 /100 | #111 | Exceptional 11.6% |
| Immigrants | Southern Europe | 90.8 /100 | #112 | Exceptional 11.6% |
| Immigrants | Belarus | 90.8 /100 | #113 | Exceptional 11.6% |
| Immigrants | China | 90.7 /100 | #114 | Exceptional 11.6% |
| Albanians | 90.3 /100 | #115 | Exceptional 11.7% |
| Immigrants | Russia | 89.7 /100 | #116 | Excellent 11.7% |
| Sri Lankans | 89.4 /100 | #117 | Excellent 11.7% |
| Argentineans | 89.1 /100 | #118 | Excellent 11.7% |
| Tlingit-Haida | 89.0 /100 | #119 | Excellent 11.7% |
Demographics Similar to Immigrants from Yemen by Poverty
In terms of poverty, the demographic groups most similar to Immigrants from Yemen are Pima (21.9%, a difference of 1.6%), Lumbee (21.9%, a difference of 1.9%), Hopi (20.8%, a difference of 3.2%), Yup'ik (20.8%, a difference of 3.4%), and Crow (20.7%, a difference of 4.1%).
| Demographics | Rating | Rank | Poverty |
| Houma | 0.0 /100 | #333 | Tragic 18.4% |
| Apache | 0.0 /100 | #334 | Tragic 18.4% |
| Cheyenne | 0.0 /100 | #335 | Tragic 18.9% |
| Pueblo | 0.0 /100 | #336 | Tragic 19.4% |
| Sioux | 0.0 /100 | #337 | Tragic 19.8% |
| Yuman | 0.0 /100 | #338 | Tragic 20.2% |
| Crow | 0.0 /100 | #339 | Tragic 20.7% |
| Yup'ik | 0.0 /100 | #340 | Tragic 20.8% |
| Hopi | 0.0 /100 | #341 | Tragic 20.8% |
| Immigrants | Yemen | 0.0 /100 | #342 | Tragic 21.5% |
| Pima | 0.0 /100 | #343 | Tragic 21.9% |
| Lumbee | 0.0 /100 | #344 | Tragic 21.9% |
| Navajo | 0.0 /100 | #345 | Tragic 23.1% |
| Puerto Ricans | 0.0 /100 | #346 | Tragic 23.7% |
| Tohono O'odham | 0.0 /100 | #347 | Tragic 24.4% |