Immigrants from Southern Europe vs Immigrants from Austria Single Male Poverty
COMPARE
Immigrants from Southern Europe
Immigrants from Austria
Single Male Poverty
Single Male Poverty Comparison
Immigrants from Southern Europe
Immigrants from Austria
12.4%
SINGLE MALE POVERTY
91.5/ 100
METRIC RATING
115th/ 347
METRIC RANK
12.5%
SINGLE MALE POVERTY
81.9/ 100
METRIC RATING
136th/ 347
METRIC RANK
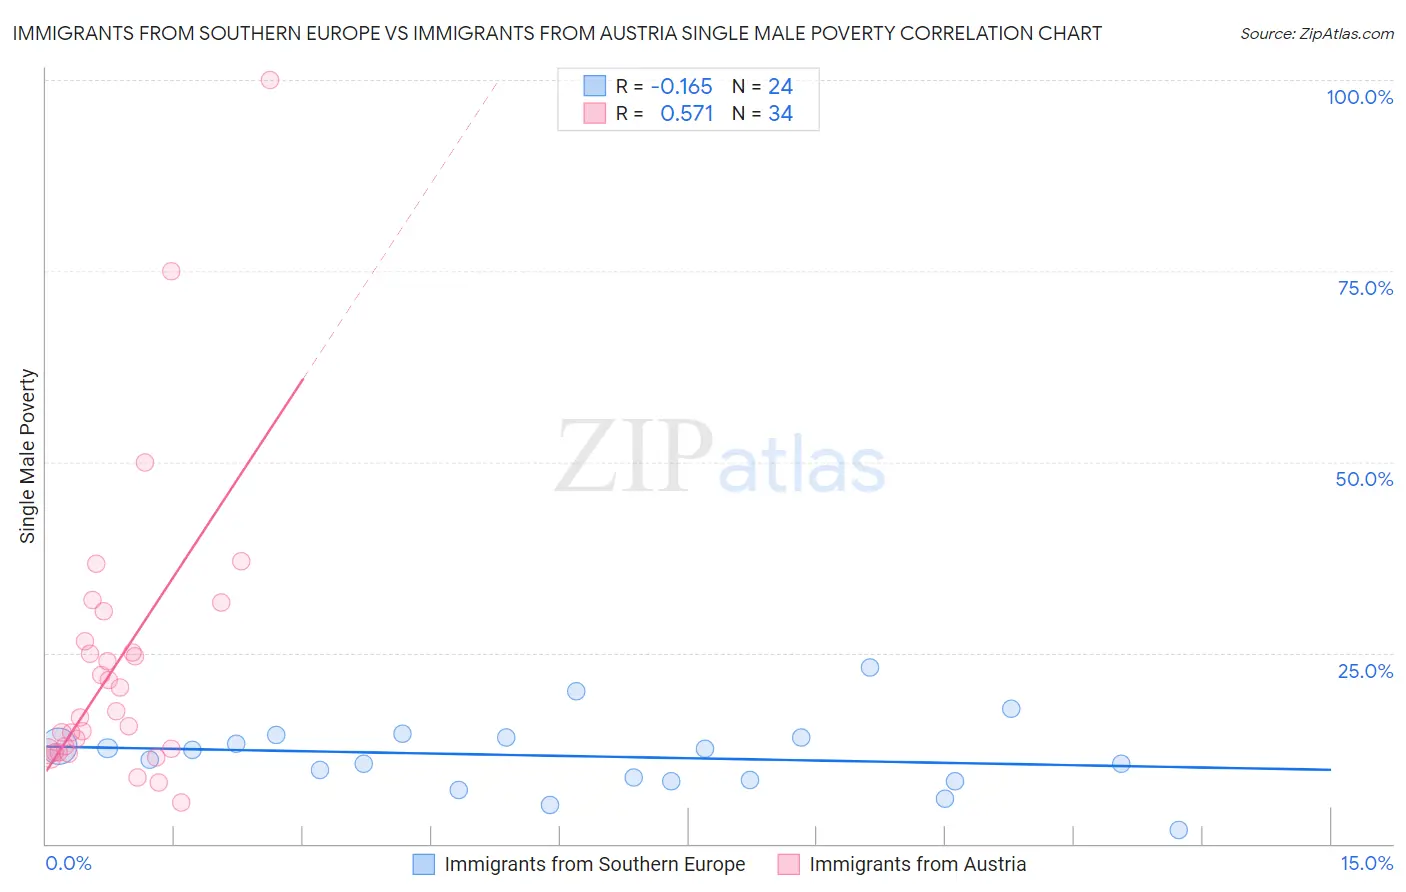
Immigrants from Southern Europe vs Immigrants from Austria Single Male Poverty Correlation Chart
The statistical analysis conducted on geographies consisting of 351,913,565 people shows a poor negative correlation between the proportion of Immigrants from Southern Europe and poverty level among single males in the United States with a correlation coefficient (R) of -0.165 and weighted average of 12.4%. Similarly, the statistical analysis conducted on geographies consisting of 154,466,694 people shows a substantial positive correlation between the proportion of Immigrants from Austria and poverty level among single males in the United States with a correlation coefficient (R) of 0.571 and weighted average of 12.5%, a difference of 1.2%.
Single Male Poverty Correlation Summary
| Measurement | Immigrants from Southern Europe | Immigrants from Austria |
| Minimum | 1.7% | 5.5% |
| Maximum | 23.1% | 100.0% |
| Range | 21.4% | 94.5% |
| Mean | 11.5% | 23.7% |
| Median | 11.7% | 17.0% |
| Interquartile 25% (IQ1) | 8.3% | 12.1% |
| Interquartile 75% (IQ3) | 13.9% | 26.6% |
| Interquartile Range (IQR) | 5.7% | 14.4% |
| Standard Deviation (Sample) | 4.7% | 19.2% |
| Standard Deviation (Population) | 4.6% | 18.9% |
Similar Demographics by Single Male Poverty
Demographics Similar to Immigrants from Southern Europe by Single Male Poverty
In terms of single male poverty, the demographic groups most similar to Immigrants from Southern Europe are Immigrants from Syria (12.4%, a difference of 0.060%), Immigrants from Oceania (12.4%, a difference of 0.070%), Nicaraguan (12.4%, a difference of 0.11%), Pakistani (12.4%, a difference of 0.15%), and Albanian (12.4%, a difference of 0.16%).
| Demographics | Rating | Rank | Single Male Poverty |
| Immigrants | Eastern Africa | 95.0 /100 | #108 | Exceptional 12.3% |
| Ugandans | 94.5 /100 | #109 | Exceptional 12.3% |
| Immigrants | Portugal | 93.6 /100 | #110 | Exceptional 12.3% |
| Immigrants | North Macedonia | 93.6 /100 | #111 | Exceptional 12.3% |
| Kenyans | 93.3 /100 | #112 | Exceptional 12.4% |
| Pakistanis | 92.4 /100 | #113 | Exceptional 12.4% |
| Nicaraguans | 92.1 /100 | #114 | Exceptional 12.4% |
| Immigrants | Southern Europe | 91.5 /100 | #115 | Exceptional 12.4% |
| Immigrants | Syria | 91.2 /100 | #116 | Exceptional 12.4% |
| Immigrants | Oceania | 91.1 /100 | #117 | Exceptional 12.4% |
| Albanians | 90.6 /100 | #118 | Exceptional 12.4% |
| Immigrants | Albania | 90.3 /100 | #119 | Exceptional 12.4% |
| Venezuelans | 89.4 /100 | #120 | Excellent 12.4% |
| Icelanders | 88.2 /100 | #121 | Excellent 12.5% |
| Serbians | 87.9 /100 | #122 | Excellent 12.5% |
Demographics Similar to Immigrants from Austria by Single Male Poverty
In terms of single male poverty, the demographic groups most similar to Immigrants from Austria are Immigrants from Costa Rica (12.5%, a difference of 0.0%), Immigrants from Ecuador (12.5%, a difference of 0.010%), Ukrainian (12.6%, a difference of 0.11%), Immigrants from Western Asia (12.5%, a difference of 0.14%), and Immigrants from El Salvador (12.6%, a difference of 0.16%).
| Demographics | Rating | Rank | Single Male Poverty |
| Immigrants | Sierra Leone | 85.5 /100 | #129 | Excellent 12.5% |
| Immigrants | Nicaragua | 84.8 /100 | #130 | Excellent 12.5% |
| Immigrants | Northern Europe | 83.7 /100 | #131 | Excellent 12.5% |
| Salvadorans | 83.7 /100 | #132 | Excellent 12.5% |
| Immigrants | Western Asia | 83.4 /100 | #133 | Excellent 12.5% |
| Immigrants | Ecuador | 82.1 /100 | #134 | Excellent 12.5% |
| Immigrants | Costa Rica | 81.9 /100 | #135 | Excellent 12.5% |
| Immigrants | Austria | 81.9 /100 | #136 | Excellent 12.5% |
| Ukrainians | 80.7 /100 | #137 | Excellent 12.6% |
| Immigrants | El Salvador | 80.0 /100 | #138 | Excellent 12.6% |
| Cubans | 79.9 /100 | #139 | Good 12.6% |
| Immigrants | Zimbabwe | 78.0 /100 | #140 | Good 12.6% |
| Okinawans | 75.9 /100 | #141 | Good 12.6% |
| Immigrants | Uganda | 75.9 /100 | #142 | Good 12.6% |
| Immigrants | France | 75.8 /100 | #143 | Good 12.6% |