Immigrants from South Eastern Asia vs Immigrants from Malaysia Female Poverty
COMPARE
Immigrants from South Eastern Asia
Immigrants from Malaysia
Female Poverty
Female Poverty Comparison
Immigrants from South Eastern Asia
Immigrants from Malaysia
12.7%
FEMALE POVERTY
89.9/ 100
METRIC RATING
123rd/ 347
METRIC RANK
13.0%
FEMALE POVERTY
80.4/ 100
METRIC RATING
143rd/ 347
METRIC RANK
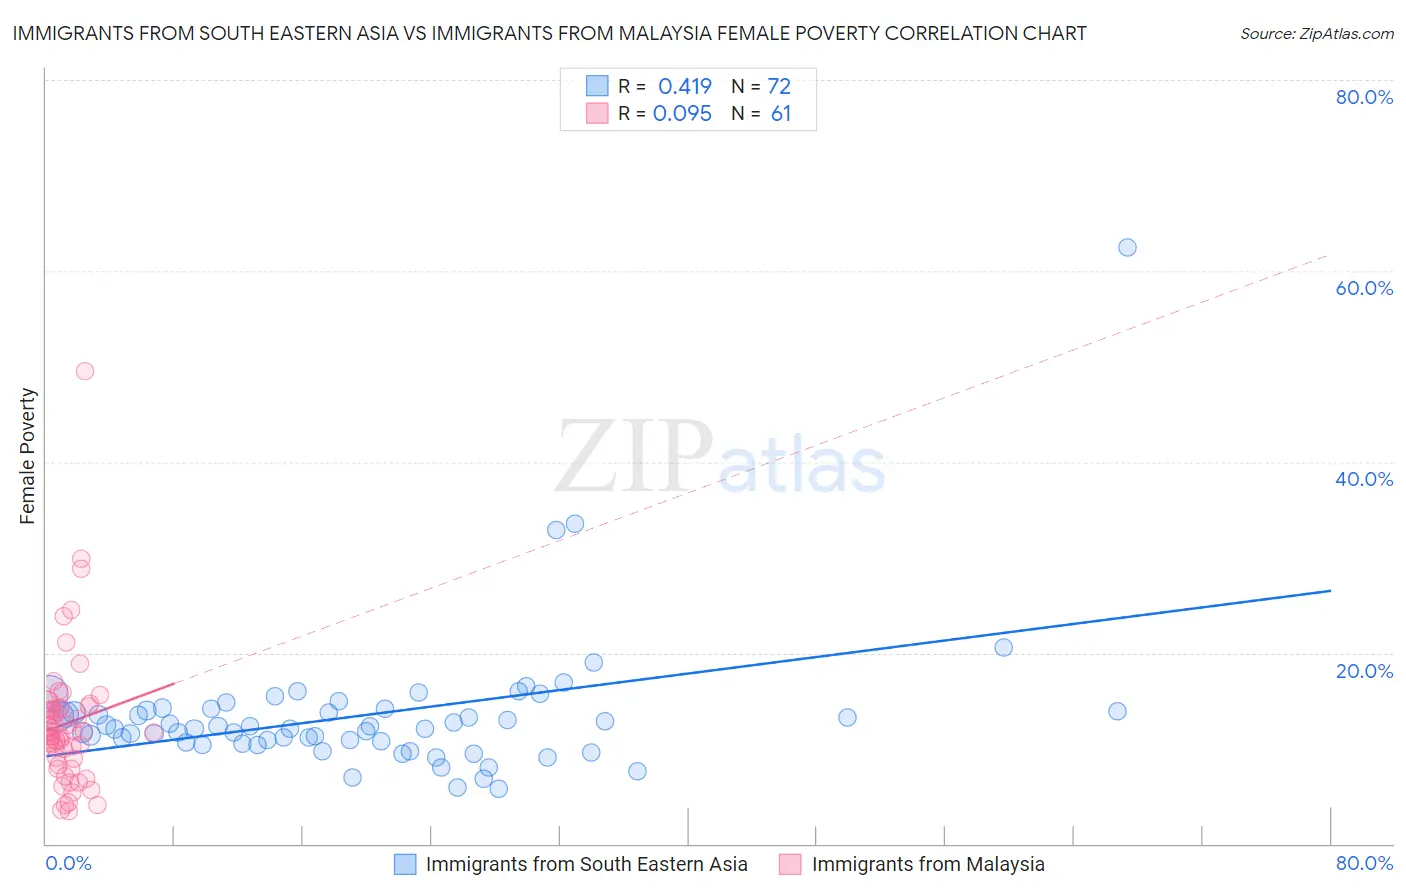
Immigrants from South Eastern Asia vs Immigrants from Malaysia Female Poverty Correlation Chart
The statistical analysis conducted on geographies consisting of 512,071,275 people shows a moderate positive correlation between the proportion of Immigrants from South Eastern Asia and poverty level among females in the United States with a correlation coefficient (R) of 0.419 and weighted average of 12.7%. Similarly, the statistical analysis conducted on geographies consisting of 197,903,089 people shows a slight positive correlation between the proportion of Immigrants from Malaysia and poverty level among females in the United States with a correlation coefficient (R) of 0.095 and weighted average of 13.0%, a difference of 2.0%.
Female Poverty Correlation Summary
| Measurement | Immigrants from South Eastern Asia | Immigrants from Malaysia |
| Minimum | 5.8% | 3.4% |
| Maximum | 62.5% | 49.6% |
| Range | 56.7% | 46.2% |
| Mean | 13.4% | 12.6% |
| Median | 12.2% | 11.6% |
| Interquartile 25% (IQ1) | 10.6% | 8.6% |
| Interquartile 75% (IQ3) | 14.0% | 14.3% |
| Interquartile Range (IQR) | 3.4% | 5.7% |
| Standard Deviation (Sample) | 7.4% | 7.3% |
| Standard Deviation (Population) | 7.3% | 7.2% |
Demographics Similar to Immigrants from South Eastern Asia and Immigrants from Malaysia by Female Poverty
In terms of female poverty, the demographic groups most similar to Immigrants from South Eastern Asia are Immigrants from Norway (12.8%, a difference of 0.18%), Argentinean (12.8%, a difference of 0.23%), Immigrants from Ukraine (12.8%, a difference of 0.30%), South African (12.8%, a difference of 0.41%), and Immigrants from Belarus (12.8%, a difference of 0.44%). Similarly, the demographic groups most similar to Immigrants from Malaysia are Brazilian (13.0%, a difference of 0.020%), Icelander (13.0%, a difference of 0.12%), Pakistani (12.9%, a difference of 0.44%), Basque (12.9%, a difference of 0.46%), and Immigrants from France (12.9%, a difference of 0.55%).
| Demographics | Rating | Rank | Female Poverty |
| Immigrants | South Eastern Asia | 89.9 /100 | #123 | Excellent 12.7% |
| Immigrants | Norway | 89.3 /100 | #124 | Excellent 12.8% |
| Argentineans | 89.1 /100 | #125 | Excellent 12.8% |
| Immigrants | Ukraine | 88.8 /100 | #126 | Excellent 12.8% |
| South Africans | 88.4 /100 | #127 | Excellent 12.8% |
| Immigrants | Belarus | 88.2 /100 | #128 | Excellent 12.8% |
| Immigrants | Brazil | 87.9 /100 | #129 | Excellent 12.8% |
| Immigrants | Vietnam | 87.1 /100 | #130 | Excellent 12.8% |
| Immigrants | Argentina | 87.0 /100 | #131 | Excellent 12.8% |
| Immigrants | Jordan | 86.9 /100 | #132 | Excellent 12.8% |
| Immigrants | Western Europe | 86.6 /100 | #133 | Excellent 12.8% |
| Immigrants | Switzerland | 85.8 /100 | #134 | Excellent 12.9% |
| French | 85.6 /100 | #135 | Excellent 12.9% |
| Peruvians | 85.2 /100 | #136 | Excellent 12.9% |
| Chileans | 84.7 /100 | #137 | Excellent 12.9% |
| Immigrants | France | 83.6 /100 | #138 | Excellent 12.9% |
| Basques | 83.1 /100 | #139 | Excellent 12.9% |
| Pakistanis | 83.0 /100 | #140 | Excellent 12.9% |
| Icelanders | 81.1 /100 | #141 | Excellent 13.0% |
| Brazilians | 80.5 /100 | #142 | Excellent 13.0% |
| Immigrants | Malaysia | 80.4 /100 | #143 | Excellent 13.0% |