Immigrants from South Central Asia vs Creek Female Poverty Among 18-24 Year Olds

COMPARE

Immigrants from South Central Asia
Race
Ancestry
AfghanAfricanAlaska NativeAlaskan AthabascanAlbanianAleutAlsatianAmericanApacheArabArapahoArgentineanArmenianAssyrian/Chaldean/SyriacAustralianAustrianBahamianBangladeshiBarbadianBasqueBelgianBelizeanBermudanBhutaneseBlackfeetBolivianBrazilianBritishBritish West IndianBulgarianBurmeseCajunCambodianCanadianCape VerdeanCarpatho RusynCelticCentral AmericanCentral American IndianCherokeeCheyenneChickasawChileanChineseChippewaChoctawColombianColvilleComancheCosta RicanCreeCroatianCrowCubanCypriotCzechCzechoslovakianDanishDelawareDominicanDutchDutch West IndianEastern EuropeanEcuadorianEgyptianEnglishEstonianEthiopianEuropeanFijianFilipinoFinnishFrenchFrench American IndianFrench CanadianGermanGerman RussianGhanaianGreekGuamanian/ChamorroGuatemalanGuyaneseHaitianHmongHonduranHopiHoumaHungarianIcelanderIndian (Asian)IndonesianInupiatIranianIraqiIrishIroquoisIsraeliItalianJamaicanJapaneseJordanianKenyanKiowaKoreanLaotianLatvianLebaneseLiberianLithuanianLumbeeLuxembourgerMacedonianMalaysianMalteseMarshalleseMenomineeMexicanMexican American IndianMongolianMoroccanNative HawaiianNavajoNepaleseNew ZealanderNicaraguanNigerianNorthern EuropeanNorwegianOkinawanOsageOttawaPaiutePakistaniPalestinianPanamanianParaguayanPennsylvania GermanPeruvianPimaPolishPortuguesePotawatomiPuebloPuerto RicanPuget Sound SalishRomanianRussianSalvadoranSamoanScandinavianScotch-IrishScottishSeminoleSenegaleseSerbianShoshoneSierra LeoneanSiouxSlavicSlovakSloveneSomaliSouth AfricanSouth AmericanSouth American IndianSoviet UnionSpaniardSpanishSpanish AmericanSpanish American IndianSri LankanSubsaharan AfricanSudaneseSwedishSwissSyrianTaiwaneseThaiTlingit-HaidaTohono O'OdhamTonganTrinidadian and TobagonianTsimshianTurkishU.S. Virgin IslanderUgandanUkrainianUruguayanUteVenezuelanVietnameseWelshWest IndianYakamaYaquiYugoslavianYumanYup'ikZimbabwean
Immigration
NonimmigrantsImmigrantsAfghanistanAfricaAlbaniaArgentinaArmeniaAsiaAustraliaAustriaBahamasBangladeshBarbadosBelarusBelgiumBelizeBoliviaBosnia and HerzegovinaBrazilBulgariaBurma/MyanmarCabo VerdeCambodiaCameroonCanadaCaribbeanCentral AmericaChileChinaColombiaCongoCosta RicaCroatiaCubaCzechoslovakiaDenmarkDominicaDominican RepublicEastern AfricaEastern AsiaEastern EuropeEcuadorEgyptEl SalvadorEnglandEritreaEthiopiaEuropeFijiFranceGermanyGhanaGreeceGrenadaGuatemalaGuyanaHaitiHondurasHong KongHungaryIndiaIndonesiaIranIraqIrelandIsraelItalyJamaicaJapanJordanKazakhstanKenyaKoreaKuwaitLaosLatin AmericaLatviaLebanonLiberiaLithuaniaMalaysiaMexicoMicronesiaMiddle AfricaMoldovaMoroccoNepalNetherlandsNicaraguaNigeriaNorth AmericaNorth MacedoniaNorthern AfricaNorthern EuropeNorwayOceaniaPakistanPanamaPeruPhilippinesPolandPortugalRomaniaRussiaSaudi ArabiaScotlandSenegalSerbiaSierra LeoneSingaporeSomaliaSouth AfricaSouth AmericaSouth Central AsiaSouth Eastern AsiaSouthern EuropeSpainSri LankaSt. Vincent and the GrenadinesSudanSwedenSwitzerlandSyriaTaiwanThailandTrinidad and TobagoTurkeyUgandaUkraineUruguayUzbekistanVenezuelaVietnamWest IndiesWestern AfricaWestern AsiaWestern EuropeYemenZaireZimbabweAzores
Creek
Race
Ancestry
AfghanAfricanAlaska NativeAlaskan AthabascanAlbanianAleutAlsatianAmericanApacheArabArapahoArgentineanArmenianAssyrian/Chaldean/SyriacAustralianAustrianBahamianBangladeshiBarbadianBasqueBelgianBelizeanBermudanBhutaneseBlackfeetBolivianBrazilianBritishBritish West IndianBulgarianBurmeseCajunCambodianCanadianCape VerdeanCarpatho RusynCelticCentral AmericanCentral American IndianCherokeeCheyenneChickasawChileanChineseChippewaChoctawColombianColvilleComancheCosta RicanCreeCreekCroatianCrowCubanCypriotCzechCzechoslovakianDanishDelawareDominicanDutchDutch West IndianEastern EuropeanEcuadorianEgyptianEnglishEstonianEthiopianEuropeanFijianFilipinoFinnishFrenchFrench American IndianFrench CanadianGermanGerman RussianGhanaianGreekGuamanian/ChamorroGuatemalanGuyaneseHaitianHmongHonduranHopiHoumaHungarianIcelanderIndian (Asian)IndonesianInupiatIranianIraqiIrishIroquoisIsraeliItalianJamaicanJapaneseJordanianKenyanKiowaKoreanLaotianLatvianLebaneseLiberianLithuanianLumbeeLuxembourgerMacedonianMalaysianMalteseMarshalleseMenomineeMexicanMexican American IndianMongolianMoroccanNative HawaiianNavajoNepaleseNew ZealanderNicaraguanNigerianNorthern EuropeanNorwegianOkinawanOsageOttawaPaiutePakistaniPalestinianPanamanianParaguayanPennsylvania GermanPeruvianPimaPolishPortuguesePotawatomiPuebloPuerto RicanPuget Sound SalishRomanianRussianSalvadoranSamoanScandinavianScotch-IrishScottishSeminoleSenegaleseSerbianShoshoneSierra LeoneanSiouxSlavicSlovakSloveneSomaliSouth AfricanSouth AmericanSouth American IndianSoviet UnionSpaniardSpanishSpanish AmericanSpanish American IndianSri LankanSubsaharan AfricanSudaneseSwedishSwissSyrianTaiwaneseThaiTlingit-HaidaTohono O'OdhamTonganTrinidadian and TobagonianTsimshianTurkishU.S. Virgin IslanderUgandanUkrainianUruguayanUteVenezuelanVietnameseWelshWest IndianYakamaYaquiYugoslavianYumanYup'ikZimbabwean
Immigration
NonimmigrantsImmigrantsAfghanistanAfricaAlbaniaArgentinaArmeniaAsiaAustraliaAustriaBahamasBangladeshBarbadosBelarusBelgiumBelizeBoliviaBosnia and HerzegovinaBrazilBulgariaBurma/MyanmarCabo VerdeCambodiaCameroonCanadaCaribbeanCentral AmericaChileChinaColombiaCongoCosta RicaCroatiaCubaCzechoslovakiaDenmarkDominicaDominican RepublicEastern AfricaEastern AsiaEastern EuropeEcuadorEgyptEl SalvadorEnglandEritreaEthiopiaEuropeFijiFranceGermanyGhanaGreeceGrenadaGuatemalaGuyanaHaitiHondurasHong KongHungaryIndiaIndonesiaIranIraqIrelandIsraelItalyJamaicaJapanJordanKazakhstanKenyaKoreaKuwaitLaosLatin AmericaLatviaLebanonLiberiaLithuaniaMalaysiaMexicoMicronesiaMiddle AfricaMoldovaMoroccoNepalNetherlandsNicaraguaNigeriaNorth AmericaNorth MacedoniaNorthern AfricaNorthern EuropeNorwayOceaniaPakistanPanamaPeruPhilippinesPolandPortugalRomaniaRussiaSaudi ArabiaScotlandSenegalSerbiaSierra LeoneSingaporeSomaliaSouth AfricaSouth AmericaSouth Eastern AsiaSouthern EuropeSpainSri LankaSt. Vincent and the GrenadinesSudanSwedenSwitzerlandSyriaTaiwanThailandTrinidad and TobagoTurkeyUgandaUkraineUruguayUzbekistanVenezuelaVietnamWest IndiesWestern AfricaWestern AsiaWestern EuropeYemenZaireZimbabweAzores
Female Poverty Among 18-24 Year Olds
Income
Poverty
Unemployment
Labor Participation
Family Structure
Vehicle Availability
Education Level
Disability

Female Poverty Among 18-24 Year Olds Comparison

Immigrants from South Central Asia

Creek

Exceptional
Tragic
17.6%
FEMALE POVERTY AMONG 18-24 YEAR OLDS
100.0/ 100
METRIC RATING
25th/ 347
METRIC RANK
24.2%
FEMALE POVERTY AMONG 18-24 YEAR OLDS
0.0/ 100
METRIC RATING
313th/ 347
METRIC RANK

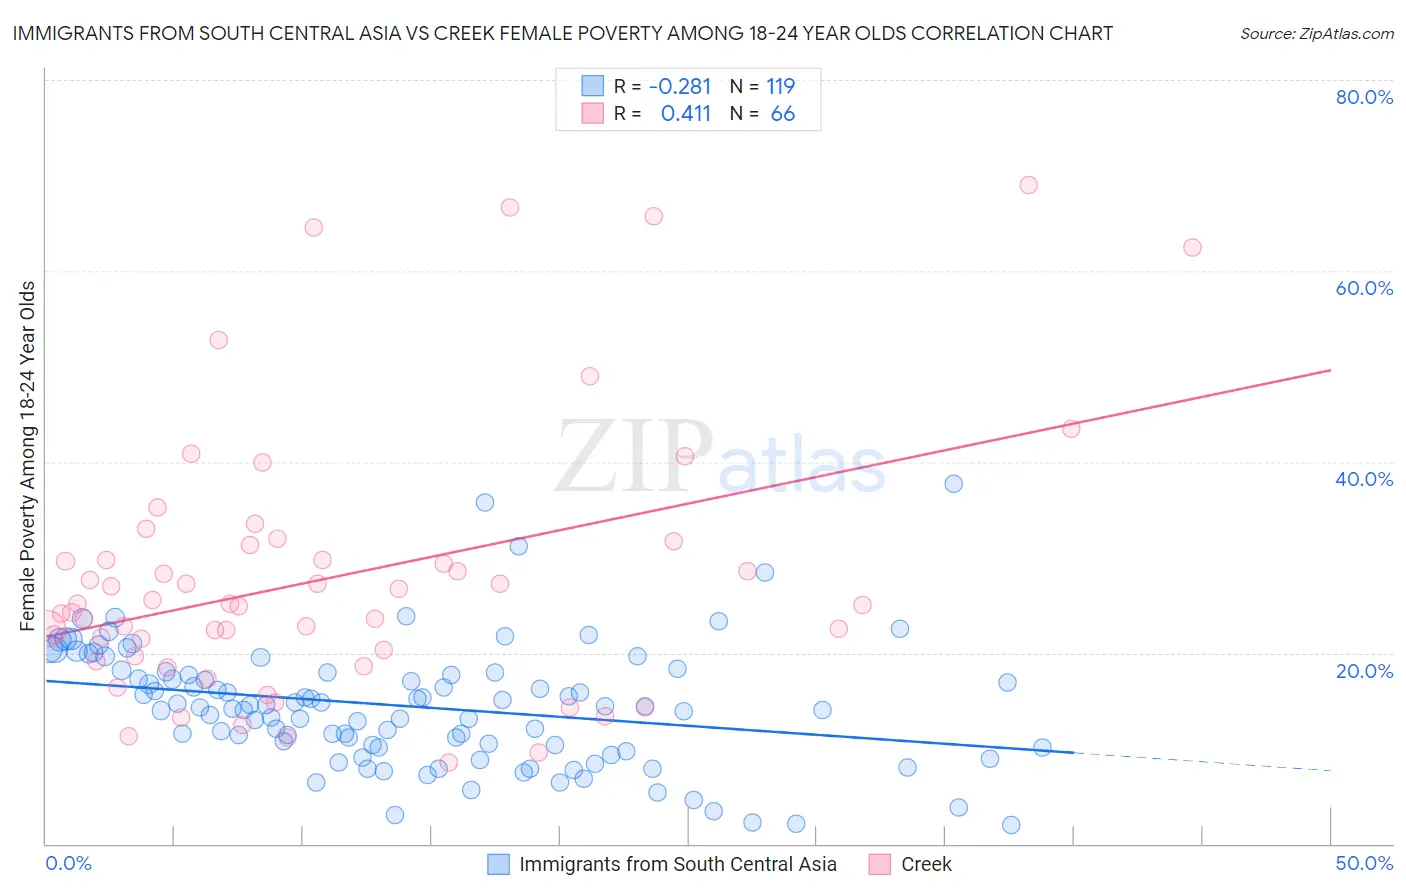
Immigrants from South Central Asia vs Creek Female Poverty Among 18-24 Year Olds Correlation Chart

The statistical analysis conducted on geographies consisting of 457,387,696 people shows a weak negative correlation between the proportion of Immigrants from South Central Asia and poverty level among females between the ages 18 and 24 in the United States with a correlation coefficient (R) of -0.281 and weighted average of 17.6%. Similarly, the statistical analysis conducted on geographies consisting of 176,646,944 people shows a moderate positive correlation between the proportion of Creek and poverty level among females between the ages 18 and 24 in the United States with a correlation coefficient (R) of 0.411 and weighted average of 24.2%, a difference of 37.7%.
Immigrants from South Central Asia vs Creek Female Poverty Among 18-24 Year Olds

Female Poverty Among 18-24 Year Olds Correlation Summary

MeasurementImmigrants from South Central AsiaCreek
Minimum1.9%8.5%
Maximum37.7%69.0%
Range35.8%60.4%
Mean14.4%28.0%
Median14.4%25.1%
Interquartile 25% (IQ1)10.1%19.7%
Interquartile 75% (IQ3)18.0%31.3%
Interquartile Range (IQR)7.9%11.7%
Standard Deviation (Sample)6.4%14.0%
Standard Deviation (Population)6.4%13.9%

Similar Demographics by Female Poverty Among 18-24 Year Olds

Demographics Similar to Immigrants from South Central Asia by Female Poverty Among 18-24 Year Olds

In terms of female poverty among 18-24 year olds, the demographic groups most similar to Immigrants from South Central Asia are Maltese (17.6%, a difference of 0.18%), Immigrants from North Macedonia (17.6%, a difference of 0.25%), Immigrants from Fiji (17.7%, a difference of 0.33%), Colombian (17.7%, a difference of 0.43%), and Venezuelan (17.7%, a difference of 0.57%).
DemographicsRating | RankFemale Poverty Among 18-24 Year Olds
Immigrants | Colombia
100.0
/100
|
#18
Exceptional
17.3%
Immigrants | Lithuania
100.0
/100
|
#19
Exceptional
17.4%
Immigrants | Venezuela
100.0
/100
|
#20
Exceptional
17.4%
Bolivians
100.0
/100
|
#21
Exceptional
17.4%
Immigrants | Hong Kong
100.0
/100
|
#22
Exceptional
17.5%
Immigrants | North Macedonia
100.0
/100
|
#23
Exceptional
17.6%
Maltese
100.0
/100
|
#24
Exceptional
17.6%
Immigrants | South Central Asia
100.0
/100
|
#25
Exceptional
17.6%
Immigrants | Fiji
100.0
/100
|
#26
Exceptional
17.7%
Colombians
100.0
/100
|
#27
Exceptional
17.7%
Venezuelans
100.0
/100
|
#28
Exceptional
17.7%
Portuguese
100.0
/100
|
#29
Exceptional
17.8%
Immigrants | South Eastern Asia
100.0
/100
|
#30
Exceptional
17.8%
Immigrants | Vietnam
100.0
/100
|
#31
Exceptional
17.8%
Immigrants | Moldova
100.0
/100
|
#32
Exceptional
17.9%

Demographics Similar to Creek by Female Poverty Among 18-24 Year Olds

In terms of female poverty among 18-24 year olds, the demographic groups most similar to Creek are Choctaw (24.3%, a difference of 0.16%), Black/African American (24.3%, a difference of 0.36%), Alsatian (24.4%, a difference of 0.67%), Osage (24.5%, a difference of 0.97%), and Chickasaw (24.5%, a difference of 1.1%).
DemographicsRating | RankFemale Poverty Among 18-24 Year Olds
Paiute
0.0
/100
|
#306
Tragic
23.3%
Cree
0.0
/100
|
#307
Tragic
23.4%
Immigrants | Sudan
0.0
/100
|
#308
Tragic
23.5%
Blackfeet
0.0
/100
|
#309
Tragic
23.6%
Comanche
0.0
/100
|
#310
Tragic
23.6%
Potawatomi
0.0
/100
|
#311
Tragic
23.7%
Yuman
0.0
/100
|
#312
Tragic
24.0%
Creek
0.0
/100
|
#313
Tragic
24.2%
Choctaw
0.0
/100
|
#314
Tragic
24.3%
Blacks/African Americans
0.0
/100
|
#315
Tragic
24.3%
Alsatians
0.0
/100
|
#316
Tragic
24.4%
Osage
0.0
/100
|
#317
Tragic
24.5%
Chickasaw
0.0
/100
|
#318
Tragic
24.5%
Dutch West Indians
0.0
/100
|
#319
Tragic
24.5%
Immigrants | Congo
0.0
/100
|
#320
Tragic
24.6%