Immigrants from South America vs Immigrants Single Father Poverty
COMPARE
Immigrants from South America
Immigrants
Single Father Poverty
Single Father Poverty Comparison
Immigrants from South America
Immigrants
15.9%
SINGLE FATHER POVERTY
88.5/ 100
METRIC RATING
134th/ 347
METRIC RANK
15.9%
SINGLE FATHER POVERTY
91.9/ 100
METRIC RATING
121st/ 347
METRIC RANK
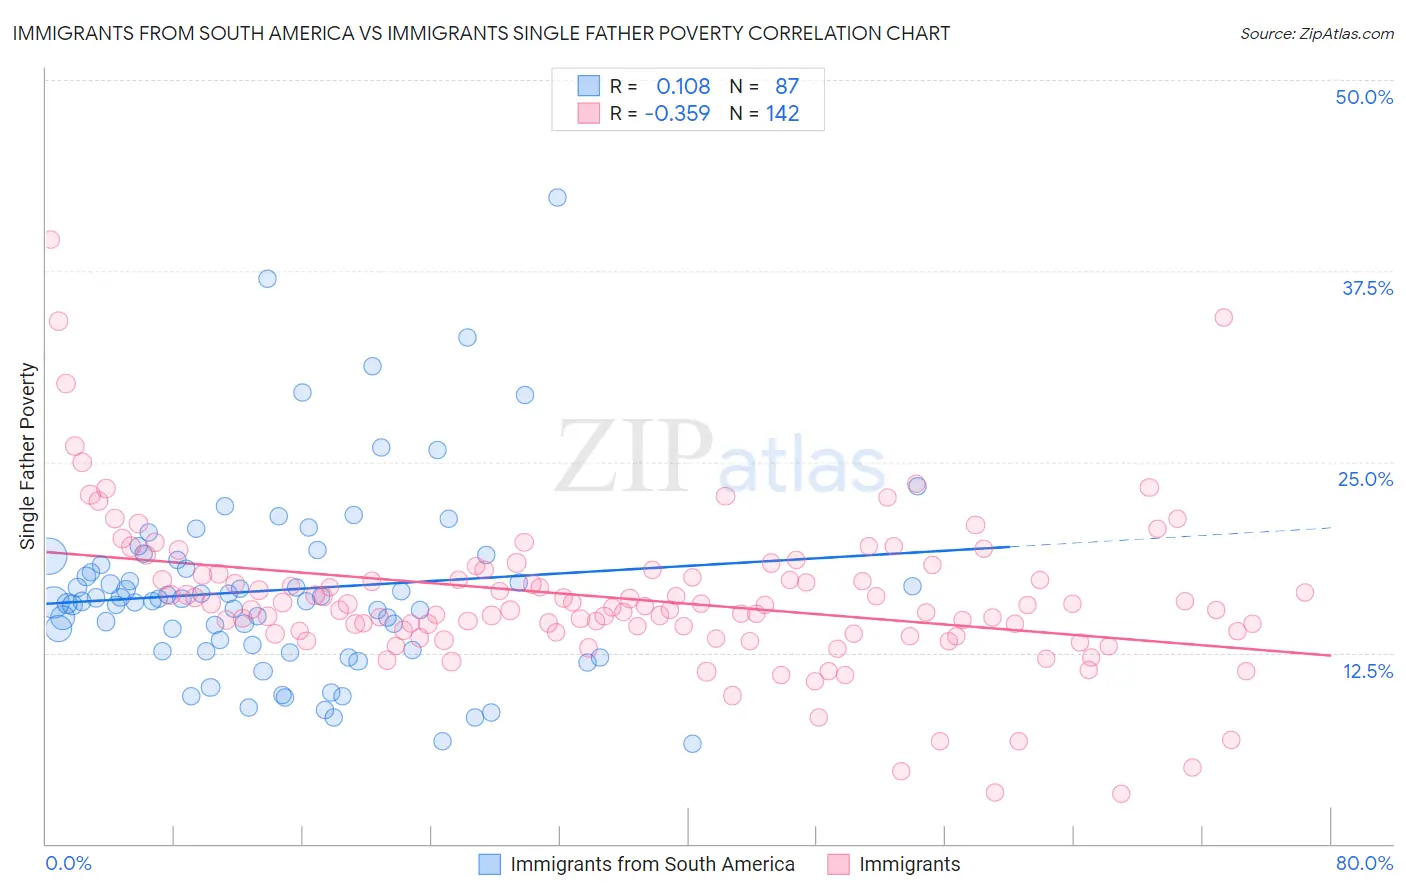
Immigrants from South America vs Immigrants Single Father Poverty Correlation Chart
The statistical analysis conducted on geographies consisting of 368,242,482 people shows a poor positive correlation between the proportion of Immigrants from South America and poverty level among single fathers in the United States with a correlation coefficient (R) of 0.108 and weighted average of 15.9%. Similarly, the statistical analysis conducted on geographies consisting of 413,041,204 people shows a mild negative correlation between the proportion of Immigrants and poverty level among single fathers in the United States with a correlation coefficient (R) of -0.359 and weighted average of 15.9%, a difference of 0.45%.
Single Father Poverty Correlation Summary
| Measurement | Immigrants from South America | Immigrants |
| Minimum | 6.6% | 3.3% |
| Maximum | 42.3% | 39.5% |
| Range | 35.8% | 36.3% |
| Mean | 16.6% | 16.0% |
| Median | 15.9% | 15.5% |
| Interquartile 25% (IQ1) | 12.7% | 13.9% |
| Interquartile 75% (IQ3) | 18.6% | 17.6% |
| Interquartile Range (IQR) | 5.9% | 3.8% |
| Standard Deviation (Sample) | 6.2% | 5.0% |
| Standard Deviation (Population) | 6.2% | 5.0% |
Demographics Similar to Immigrants from South America and Immigrants by Single Father Poverty
In terms of single father poverty, the demographic groups most similar to Immigrants from South America are Immigrants from Sri Lanka (15.9%, a difference of 0.030%), Cypriot (15.9%, a difference of 0.10%), Immigrants from Syria (15.9%, a difference of 0.12%), Immigrants from the Azores (15.9%, a difference of 0.13%), and Immigrants from Portugal (15.9%, a difference of 0.14%). Similarly, the demographic groups most similar to Immigrants are Uruguayan (15.9%, a difference of 0.020%), Sudanese (15.9%, a difference of 0.060%), Immigrants from Belarus (15.8%, a difference of 0.080%), Immigrants from Eastern Europe (15.8%, a difference of 0.090%), and Palestinian (15.9%, a difference of 0.10%).
| Demographics | Rating | Rank | Single Father Poverty |
| Immigrants | Colombia | 92.6 /100 | #117 | Exceptional 15.8% |
| Immigrants | Eastern Europe | 92.5 /100 | #118 | Exceptional 15.8% |
| Immigrants | Belarus | 92.4 /100 | #119 | Exceptional 15.8% |
| Uruguayans | 92.1 /100 | #120 | Exceptional 15.9% |
| Immigrants | Immigrants | 91.9 /100 | #121 | Exceptional 15.9% |
| Sudanese | 91.6 /100 | #122 | Exceptional 15.9% |
| Palestinians | 91.3 /100 | #123 | Exceptional 15.9% |
| Immigrants | Panama | 91.3 /100 | #124 | Exceptional 15.9% |
| Iraqis | 91.2 /100 | #125 | Exceptional 15.9% |
| Hmong | 91.1 /100 | #126 | Exceptional 15.9% |
| Immigrants | Liberia | 91.1 /100 | #127 | Exceptional 15.9% |
| Immigrants | Nigeria | 90.8 /100 | #128 | Exceptional 15.9% |
| Immigrants | West Indies | 90.8 /100 | #129 | Exceptional 15.9% |
| Norwegians | 90.2 /100 | #130 | Exceptional 15.9% |
| Nicaraguans | 90.1 /100 | #131 | Exceptional 15.9% |
| Immigrants | Portugal | 89.7 /100 | #132 | Excellent 15.9% |
| Immigrants | Syria | 89.5 /100 | #133 | Excellent 15.9% |
| Immigrants | South America | 88.5 /100 | #134 | Excellent 15.9% |
| Immigrants | Sri Lanka | 88.2 /100 | #135 | Excellent 15.9% |
| Cypriots | 87.5 /100 | #136 | Excellent 15.9% |
| Immigrants | Azores | 87.2 /100 | #137 | Excellent 15.9% |