Immigrants from South Africa vs Honduran Child Poverty Among Girls Under 16
COMPARE
Immigrants from South Africa
Honduran
Child Poverty Among Girls Under 16
Child Poverty Among Girls Under 16 Comparison
Immigrants from South Africa
Hondurans
15.0%
CHILD POVERTY AMONG GIRLS UNDER 16
95.6/ 100
METRIC RATING
101st/ 347
METRIC RANK
22.2%
CHILD POVERTY AMONG GIRLS UNDER 16
0.0/ 100
METRIC RATING
320th/ 347
METRIC RANK
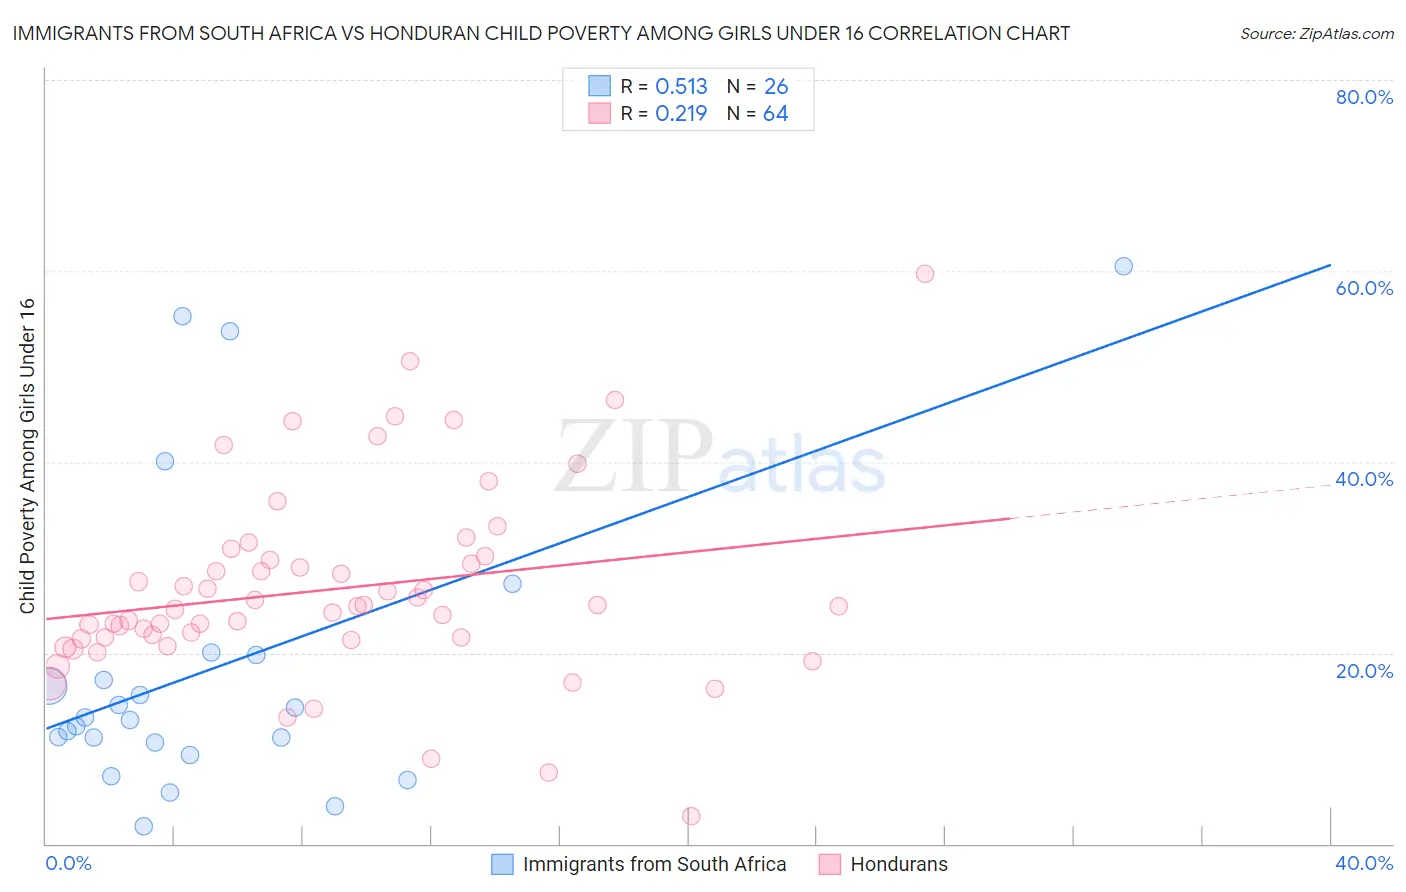
Immigrants from South Africa vs Honduran Child Poverty Among Girls Under 16 Correlation Chart
The statistical analysis conducted on geographies consisting of 230,120,116 people shows a substantial positive correlation between the proportion of Immigrants from South Africa and poverty level among girls under the age of 16 in the United States with a correlation coefficient (R) of 0.513 and weighted average of 15.0%. Similarly, the statistical analysis conducted on geographies consisting of 354,249,736 people shows a weak positive correlation between the proportion of Hondurans and poverty level among girls under the age of 16 in the United States with a correlation coefficient (R) of 0.219 and weighted average of 22.2%, a difference of 48.2%.
Child Poverty Among Girls Under 16 Correlation Summary
| Measurement | Immigrants from South Africa | Honduran |
| Minimum | 1.8% | 2.8% |
| Maximum | 60.5% | 59.7% |
| Range | 58.6% | 56.9% |
| Mean | 18.6% | 26.7% |
| Median | 13.1% | 24.9% |
| Interquartile 25% (IQ1) | 10.6% | 21.5% |
| Interquartile 75% (IQ3) | 19.8% | 30.0% |
| Interquartile Range (IQR) | 9.2% | 8.4% |
| Standard Deviation (Sample) | 15.9% | 10.2% |
| Standard Deviation (Population) | 15.6% | 10.1% |
Similar Demographics by Child Poverty Among Girls Under 16
Demographics Similar to Immigrants from South Africa by Child Poverty Among Girls Under 16
In terms of child poverty among girls under 16, the demographic groups most similar to Immigrants from South Africa are Immigrants from Malaysia (15.0%, a difference of 0.010%), Paraguayan (15.0%, a difference of 0.030%), British (15.0%, a difference of 0.030%), Immigrants from Egypt (15.0%, a difference of 0.070%), and Romanian (15.0%, a difference of 0.19%).
| Demographics | Rating | Rank | Child Poverty Among Girls Under 16 |
| Immigrants | Switzerland | 96.3 /100 | #94 | Exceptional 14.9% |
| Germans | 96.3 /100 | #95 | Exceptional 14.9% |
| Immigrants | France | 96.2 /100 | #96 | Exceptional 14.9% |
| Immigrants | Latvia | 96.1 /100 | #97 | Exceptional 14.9% |
| Basques | 95.9 /100 | #98 | Exceptional 15.0% |
| Immigrants | Egypt | 95.7 /100 | #99 | Exceptional 15.0% |
| Paraguayans | 95.7 /100 | #100 | Exceptional 15.0% |
| Immigrants | South Africa | 95.6 /100 | #101 | Exceptional 15.0% |
| Immigrants | Malaysia | 95.6 /100 | #102 | Exceptional 15.0% |
| British | 95.6 /100 | #103 | Exceptional 15.0% |
| Romanians | 95.3 /100 | #104 | Exceptional 15.0% |
| Immigrants | England | 95.1 /100 | #105 | Exceptional 15.1% |
| Chileans | 95.1 /100 | #106 | Exceptional 15.1% |
| Immigrants | Ukraine | 95.0 /100 | #107 | Exceptional 15.1% |
| Immigrants | Brazil | 94.9 /100 | #108 | Exceptional 15.1% |
Demographics Similar to Hondurans by Child Poverty Among Girls Under 16
In terms of child poverty among girls under 16, the demographic groups most similar to Hondurans are U.S. Virgin Islander (22.1%, a difference of 0.60%), Immigrants from Dominica (22.1%, a difference of 0.76%), Colville (22.5%, a difference of 1.3%), African (21.9%, a difference of 1.4%), and Yakama (22.6%, a difference of 1.5%).
| Demographics | Rating | Rank | Child Poverty Among Girls Under 16 |
| Creek | 0.0 /100 | #313 | Tragic 21.7% |
| Arapaho | 0.0 /100 | #314 | Tragic 21.7% |
| Ute | 0.0 /100 | #315 | Tragic 21.8% |
| Immigrants | Guatemala | 0.0 /100 | #316 | Tragic 21.9% |
| Africans | 0.0 /100 | #317 | Tragic 21.9% |
| Immigrants | Dominica | 0.0 /100 | #318 | Tragic 22.1% |
| U.S. Virgin Islanders | 0.0 /100 | #319 | Tragic 22.1% |
| Hondurans | 0.0 /100 | #320 | Tragic 22.2% |
| Colville | 0.0 /100 | #321 | Tragic 22.5% |
| Yakama | 0.0 /100 | #322 | Tragic 22.6% |
| Cajuns | 0.0 /100 | #323 | Tragic 22.6% |
| Paiute | 0.0 /100 | #324 | Tragic 22.6% |
| Immigrants | Congo | 0.0 /100 | #325 | Tragic 22.7% |
| Immigrants | Honduras | 0.0 /100 | #326 | Tragic 22.8% |
| Central American Indians | 0.0 /100 | #327 | Tragic 22.8% |