Immigrants from South Africa vs Comanche Female Poverty Among 18-24 Year Olds
COMPARE
Immigrants from South Africa
Comanche
Female Poverty Among 18-24 Year Olds
Female Poverty Among 18-24 Year Olds Comparison
Immigrants from South Africa
Comanche
20.6%
FEMALE POVERTY AMONG 18-24 YEAR OLDS
10.7/ 100
METRIC RATING
214th/ 347
METRIC RANK
23.6%
FEMALE POVERTY AMONG 18-24 YEAR OLDS
0.0/ 100
METRIC RATING
310th/ 347
METRIC RANK
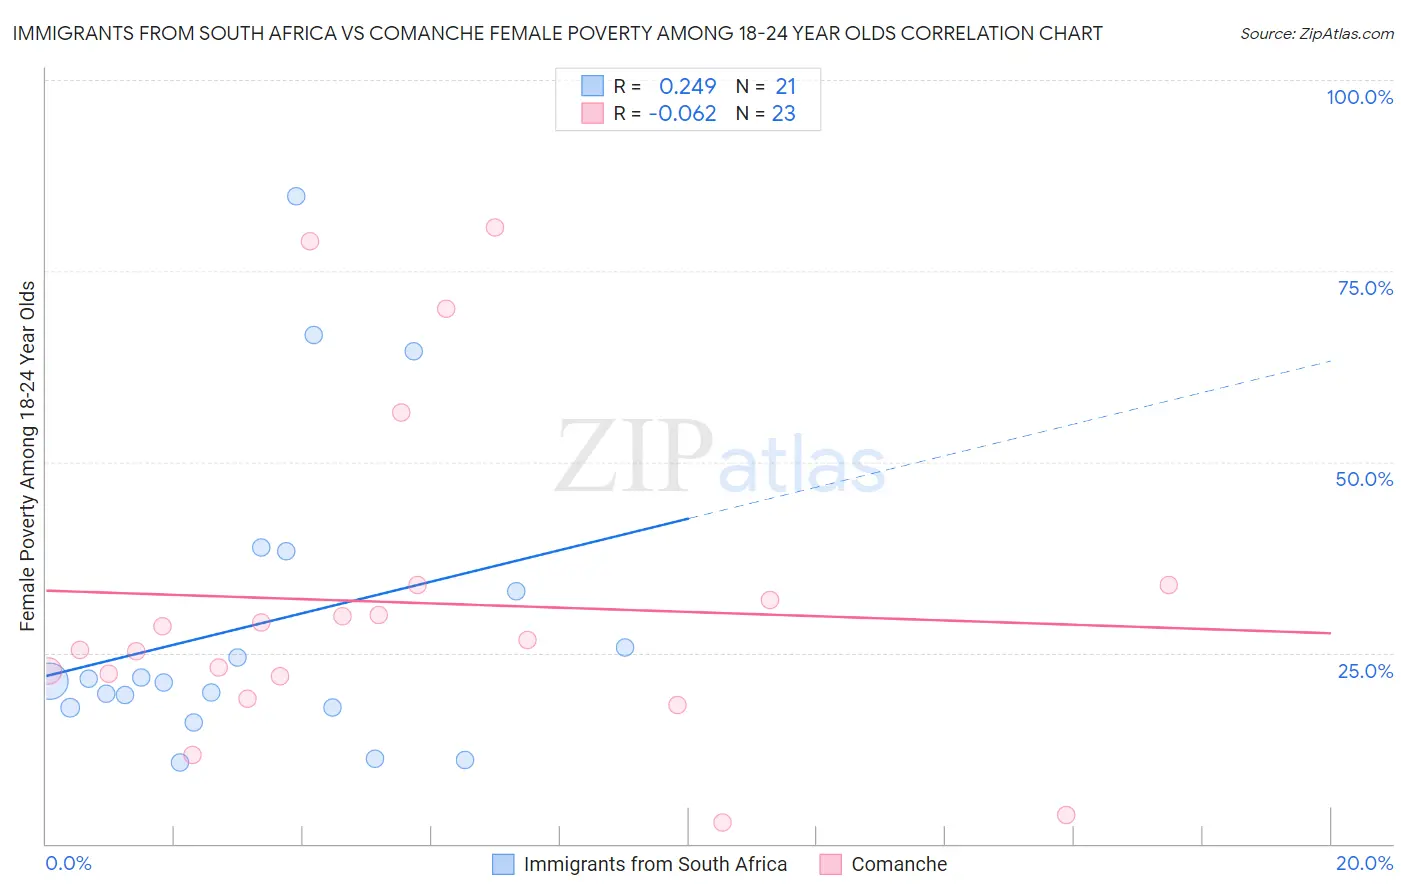
Immigrants from South Africa vs Comanche Female Poverty Among 18-24 Year Olds Correlation Chart
The statistical analysis conducted on geographies consisting of 229,352,607 people shows a weak positive correlation between the proportion of Immigrants from South Africa and poverty level among females between the ages 18 and 24 in the United States with a correlation coefficient (R) of 0.249 and weighted average of 20.6%. Similarly, the statistical analysis conducted on geographies consisting of 109,070,377 people shows a slight negative correlation between the proportion of Comanche and poverty level among females between the ages 18 and 24 in the United States with a correlation coefficient (R) of -0.062 and weighted average of 23.6%, a difference of 14.5%.
Female Poverty Among 18-24 Year Olds Correlation Summary
| Measurement | Immigrants from South Africa | Comanche |
| Minimum | 10.6% | 2.9% |
| Maximum | 84.8% | 80.7% |
| Range | 74.2% | 77.8% |
| Mean | 28.8% | 31.5% |
| Median | 21.3% | 26.7% |
| Interquartile 25% (IQ1) | 17.8% | 21.9% |
| Interquartile 75% (IQ3) | 35.7% | 33.9% |
| Interquartile Range (IQR) | 17.9% | 12.0% |
| Standard Deviation (Sample) | 19.9% | 20.8% |
| Standard Deviation (Population) | 19.4% | 20.4% |
Similar Demographics by Female Poverty Among 18-24 Year Olds
Demographics Similar to Immigrants from South Africa by Female Poverty Among 18-24 Year Olds
In terms of female poverty among 18-24 year olds, the demographic groups most similar to Immigrants from South Africa are Spanish (20.6%, a difference of 0.040%), Immigrants from Western Africa (20.6%, a difference of 0.050%), Northern European (20.6%, a difference of 0.11%), Liberian (20.6%, a difference of 0.12%), and Immigrants from Laos (20.6%, a difference of 0.13%).
| Demographics | Rating | Rank | Female Poverty Among 18-24 Year Olds |
| Spaniards | 16.3 /100 | #207 | Poor 20.5% |
| Dutch | 15.9 /100 | #208 | Poor 20.5% |
| Arabs | 15.5 /100 | #209 | Poor 20.5% |
| Immigrants | Ghana | 14.3 /100 | #210 | Poor 20.5% |
| Immigrants | Western Europe | 13.5 /100 | #211 | Poor 20.6% |
| Liberians | 11.6 /100 | #212 | Poor 20.6% |
| Northern Europeans | 11.6 /100 | #213 | Poor 20.6% |
| Immigrants | South Africa | 10.7 /100 | #214 | Poor 20.6% |
| Spanish | 10.4 /100 | #215 | Poor 20.6% |
| Immigrants | Western Africa | 10.2 /100 | #216 | Poor 20.6% |
| Immigrants | Laos | 9.7 /100 | #217 | Tragic 20.6% |
| Immigrants | Nepal | 9.6 /100 | #218 | Tragic 20.7% |
| Immigrants | Micronesia | 9.6 /100 | #219 | Tragic 20.7% |
| British | 9.4 /100 | #220 | Tragic 20.7% |
| Barbadians | 9.0 /100 | #221 | Tragic 20.7% |
Demographics Similar to Comanche by Female Poverty Among 18-24 Year Olds
In terms of female poverty among 18-24 year olds, the demographic groups most similar to Comanche are Blackfeet (23.6%, a difference of 0.050%), Potawatomi (23.7%, a difference of 0.29%), Immigrants from Sudan (23.5%, a difference of 0.50%), Cree (23.4%, a difference of 0.85%), and Paiute (23.3%, a difference of 1.4%).
| Demographics | Rating | Rank | Female Poverty Among 18-24 Year Olds |
| Senegalese | 0.0 /100 | #303 | Tragic 23.0% |
| Sudanese | 0.0 /100 | #304 | Tragic 23.0% |
| Immigrants | Kuwait | 0.0 /100 | #305 | Tragic 23.0% |
| Paiute | 0.0 /100 | #306 | Tragic 23.3% |
| Cree | 0.0 /100 | #307 | Tragic 23.4% |
| Immigrants | Sudan | 0.0 /100 | #308 | Tragic 23.5% |
| Blackfeet | 0.0 /100 | #309 | Tragic 23.6% |
| Comanche | 0.0 /100 | #310 | Tragic 23.6% |
| Potawatomi | 0.0 /100 | #311 | Tragic 23.7% |
| Yuman | 0.0 /100 | #312 | Tragic 24.0% |
| Creek | 0.0 /100 | #313 | Tragic 24.2% |
| Choctaw | 0.0 /100 | #314 | Tragic 24.3% |
| Blacks/African Americans | 0.0 /100 | #315 | Tragic 24.3% |
| Alsatians | 0.0 /100 | #316 | Tragic 24.4% |
| Osage | 0.0 /100 | #317 | Tragic 24.5% |