Immigrants from Singapore vs Barbadian Child Poverty Under the Age of 16
COMPARE
Immigrants from Singapore
Barbadian
Child Poverty Under the Age of 16
Child Poverty Under the Age of 16 Comparison
Immigrants from Singapore
Barbadians
12.4%
CHILD POVERTY UNDER THE AGE OF 16
100.0/ 100
METRIC RATING
8th/ 347
METRIC RANK
20.0%
CHILD POVERTY UNDER THE AGE OF 16
0.0/ 100
METRIC RATING
282nd/ 347
METRIC RANK
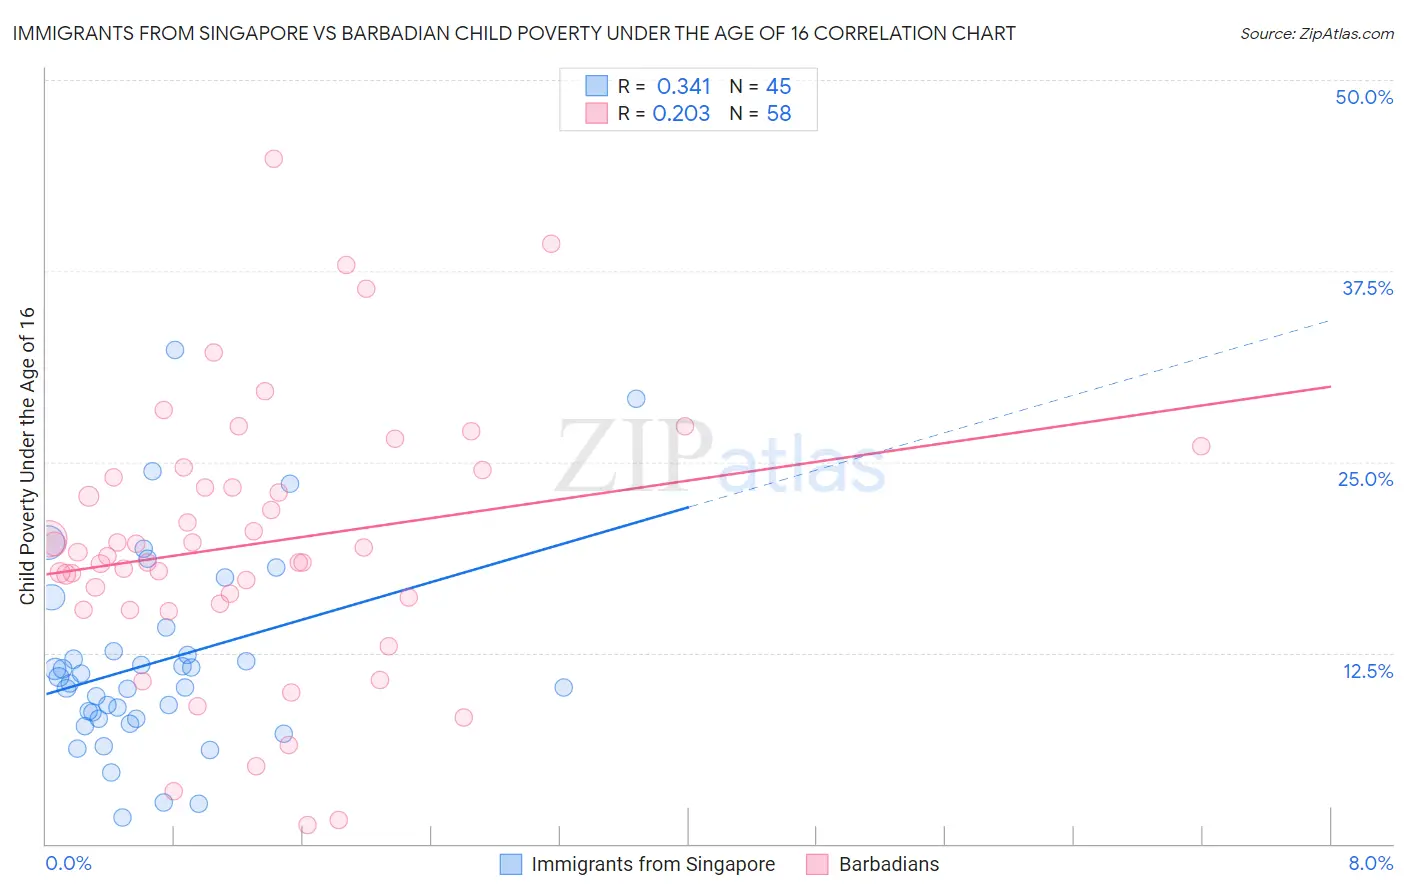
Immigrants from Singapore vs Barbadian Child Poverty Under the Age of 16 Correlation Chart
The statistical analysis conducted on geographies consisting of 136,707,022 people shows a mild positive correlation between the proportion of Immigrants from Singapore and poverty level among children under the age of 16 in the United States with a correlation coefficient (R) of 0.341 and weighted average of 12.4%. Similarly, the statistical analysis conducted on geographies consisting of 140,893,894 people shows a weak positive correlation between the proportion of Barbadians and poverty level among children under the age of 16 in the United States with a correlation coefficient (R) of 0.203 and weighted average of 20.0%, a difference of 62.2%.
Child Poverty Under the Age of 16 Correlation Summary
| Measurement | Immigrants from Singapore | Barbadian |
| Minimum | 1.7% | 1.2% |
| Maximum | 32.3% | 44.9% |
| Range | 30.6% | 43.6% |
| Mean | 11.9% | 19.6% |
| Median | 10.5% | 18.9% |
| Interquartile 25% (IQ1) | 8.2% | 15.7% |
| Interquartile 75% (IQ3) | 13.3% | 24.0% |
| Interquartile Range (IQR) | 5.1% | 8.3% |
| Standard Deviation (Sample) | 6.5% | 8.7% |
| Standard Deviation (Population) | 6.4% | 8.7% |
Similar Demographics by Child Poverty Under the Age of 16
Demographics Similar to Immigrants from Singapore by Child Poverty Under the Age of 16
In terms of child poverty under the age of 16, the demographic groups most similar to Immigrants from Singapore are Immigrants from Iran (12.4%, a difference of 0.11%), Iranian (12.2%, a difference of 1.1%), Immigrants from South Central Asia (12.5%, a difference of 1.3%), Bhutanese (12.5%, a difference of 1.3%), and Immigrants from Hong Kong (12.1%, a difference of 1.9%).
| Demographics | Rating | Rank | Child Poverty Under the Age of 16 |
| Immigrants | India | 100.0 /100 | #1 | Exceptional 10.8% |
| Immigrants | Taiwan | 100.0 /100 | #2 | Exceptional 11.0% |
| Filipinos | 100.0 /100 | #3 | Exceptional 11.1% |
| Thais | 100.0 /100 | #4 | Exceptional 11.6% |
| Chinese | 100.0 /100 | #5 | Exceptional 11.9% |
| Immigrants | Hong Kong | 100.0 /100 | #6 | Exceptional 12.1% |
| Iranians | 100.0 /100 | #7 | Exceptional 12.2% |
| Immigrants | Singapore | 100.0 /100 | #8 | Exceptional 12.4% |
| Immigrants | Iran | 100.0 /100 | #9 | Exceptional 12.4% |
| Immigrants | South Central Asia | 99.9 /100 | #10 | Exceptional 12.5% |
| Bhutanese | 99.9 /100 | #11 | Exceptional 12.5% |
| Immigrants | Ireland | 99.9 /100 | #12 | Exceptional 12.7% |
| Burmese | 99.9 /100 | #13 | Exceptional 12.8% |
| Immigrants | Lithuania | 99.9 /100 | #14 | Exceptional 12.9% |
| Immigrants | Korea | 99.9 /100 | #15 | Exceptional 13.0% |
Demographics Similar to Barbadians by Child Poverty Under the Age of 16
In terms of child poverty under the age of 16, the demographic groups most similar to Barbadians are Central American (20.0%, a difference of 0.030%), Immigrants from Zaire (20.1%, a difference of 0.23%), West Indian (20.1%, a difference of 0.37%), Immigrants from St. Vincent and the Grenadines (20.1%, a difference of 0.43%), and Immigrants from West Indies (20.2%, a difference of 0.57%).
| Demographics | Rating | Rank | Child Poverty Under the Age of 16 |
| Immigrants | Barbados | 0.1 /100 | #275 | Tragic 19.9% |
| Belizeans | 0.1 /100 | #276 | Tragic 19.9% |
| Iroquois | 0.1 /100 | #277 | Tragic 19.9% |
| Bangladeshis | 0.0 /100 | #278 | Tragic 19.9% |
| Sub-Saharan Africans | 0.0 /100 | #279 | Tragic 19.9% |
| Comanche | 0.0 /100 | #280 | Tragic 19.9% |
| Central Americans | 0.0 /100 | #281 | Tragic 20.0% |
| Barbadians | 0.0 /100 | #282 | Tragic 20.0% |
| Immigrants | Zaire | 0.0 /100 | #283 | Tragic 20.1% |
| West Indians | 0.0 /100 | #284 | Tragic 20.1% |
| Immigrants | St. Vincent and the Grenadines | 0.0 /100 | #285 | Tragic 20.1% |
| Immigrants | West Indies | 0.0 /100 | #286 | Tragic 20.2% |
| Blackfeet | 0.0 /100 | #287 | Tragic 20.2% |
| Immigrants | Belize | 0.0 /100 | #288 | Tragic 20.3% |
| Senegalese | 0.0 /100 | #289 | Tragic 20.4% |