Immigrants from Sierra Leone vs Guamanian/Chamorro Child Poverty Among Boys Under 16
COMPARE
Immigrants from Sierra Leone
Guamanian/Chamorro
Child Poverty Among Boys Under 16
Child Poverty Among Boys Under 16 Comparison
Immigrants from Sierra Leone
Guamanians/Chamorros
17.3%
CHILD POVERTY AMONG BOYS UNDER 16
13.4/ 100
METRIC RATING
202nd/ 347
METRIC RANK
16.1%
CHILD POVERTY AMONG BOYS UNDER 16
69.6/ 100
METRIC RATING
162nd/ 347
METRIC RANK
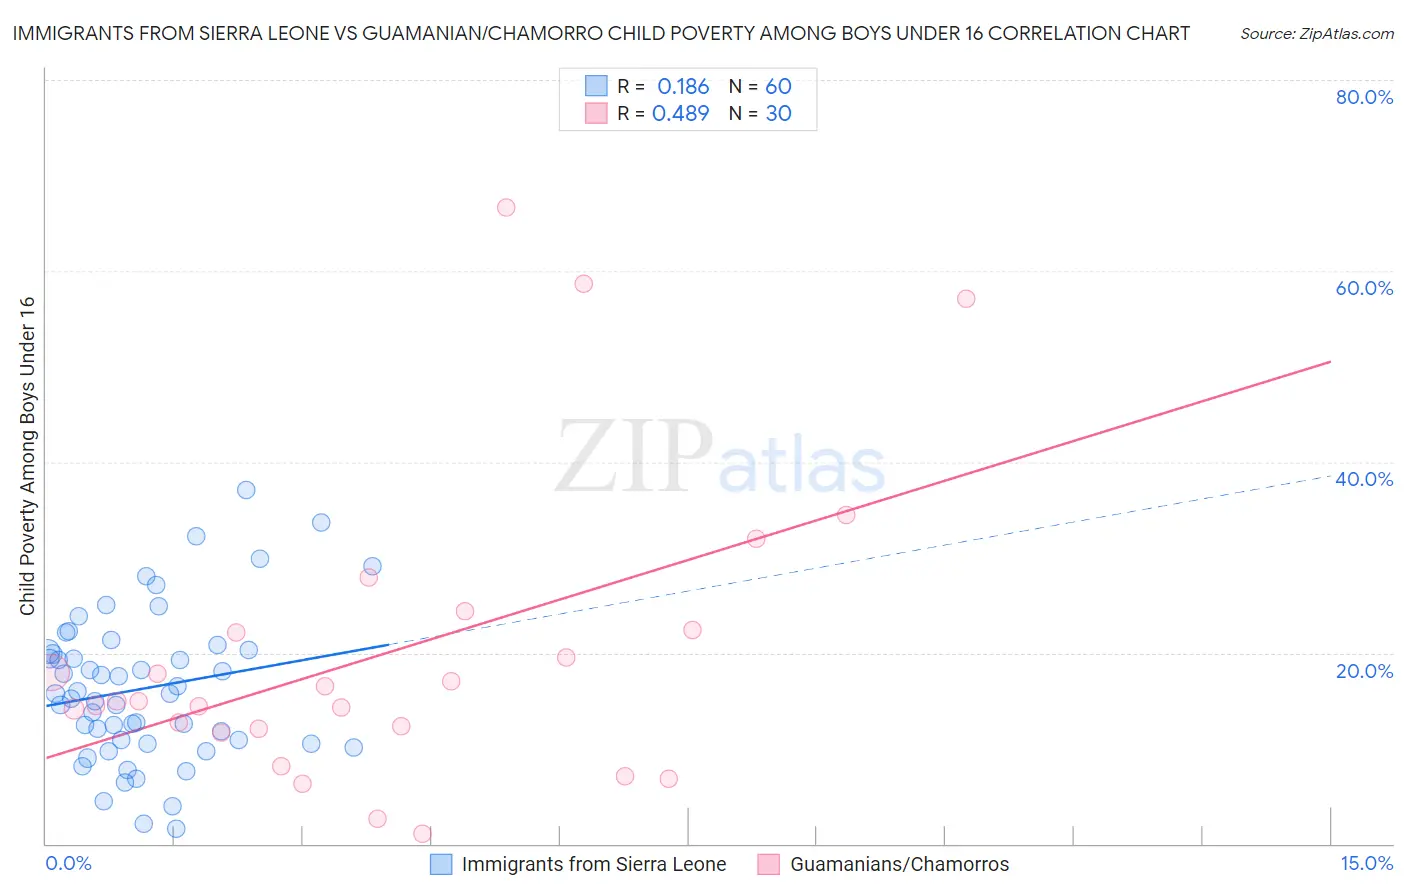
Immigrants from Sierra Leone vs Guamanian/Chamorro Child Poverty Among Boys Under 16 Correlation Chart
The statistical analysis conducted on geographies consisting of 101,288,430 people shows a poor positive correlation between the proportion of Immigrants from Sierra Leone and poverty level among boys under the age of 16 in the United States with a correlation coefficient (R) of 0.186 and weighted average of 17.3%. Similarly, the statistical analysis conducted on geographies consisting of 220,488,068 people shows a moderate positive correlation between the proportion of Guamanians/Chamorros and poverty level among boys under the age of 16 in the United States with a correlation coefficient (R) of 0.489 and weighted average of 16.1%, a difference of 7.7%.
Child Poverty Among Boys Under 16 Correlation Summary
| Measurement | Immigrants from Sierra Leone | Guamanian/Chamorro |
| Minimum | 1.6% | 1.0% |
| Maximum | 37.1% | 66.7% |
| Range | 35.5% | 65.6% |
| Mean | 16.3% | 20.1% |
| Median | 15.7% | 14.9% |
| Interquartile 25% (IQ1) | 10.7% | 12.0% |
| Interquartile 75% (IQ3) | 20.2% | 22.4% |
| Interquartile Range (IQR) | 9.5% | 10.3% |
| Standard Deviation (Sample) | 7.8% | 15.8% |
| Standard Deviation (Population) | 7.7% | 15.6% |
Similar Demographics by Child Poverty Among Boys Under 16
Demographics Similar to Immigrants from Sierra Leone by Child Poverty Among Boys Under 16
In terms of child poverty among boys under 16, the demographic groups most similar to Immigrants from Sierra Leone are Immigrants from Uzbekistan (17.3%, a difference of 0.020%), Immigrants from Afghanistan (17.3%, a difference of 0.060%), Ugandan (17.3%, a difference of 0.22%), Immigrants from Portugal (17.4%, a difference of 0.55%), and German Russian (17.4%, a difference of 0.61%).
| Demographics | Rating | Rank | Child Poverty Among Boys Under 16 |
| Spanish | 20.8 /100 | #195 | Fair 17.0% |
| Spaniards | 20.5 /100 | #196 | Fair 17.1% |
| Immigrants | Kenya | 20.1 /100 | #197 | Fair 17.1% |
| Immigrants | Cameroon | 19.0 /100 | #198 | Poor 17.1% |
| Delaware | 18.8 /100 | #199 | Poor 17.1% |
| Immigrants | Uruguay | 16.9 /100 | #200 | Poor 17.2% |
| Immigrants | Afghanistan | 13.7 /100 | #201 | Poor 17.3% |
| Immigrants | Sierra Leone | 13.4 /100 | #202 | Poor 17.3% |
| Immigrants | Uzbekistan | 13.3 /100 | #203 | Poor 17.3% |
| Ugandans | 12.5 /100 | #204 | Poor 17.3% |
| Immigrants | Portugal | 11.2 /100 | #205 | Poor 17.4% |
| German Russians | 10.9 /100 | #206 | Poor 17.4% |
| Immigrants | Thailand | 8.2 /100 | #207 | Tragic 17.5% |
| Malaysians | 7.6 /100 | #208 | Tragic 17.6% |
| Alaskan Athabascans | 7.3 /100 | #209 | Tragic 17.6% |
Demographics Similar to Guamanians/Chamorros by Child Poverty Among Boys Under 16
In terms of child poverty among boys under 16, the demographic groups most similar to Guamanians/Chamorros are Costa Rican (16.1%, a difference of 0.20%), Immigrants from Albania (16.1%, a difference of 0.22%), Immigrants from Oceania (16.0%, a difference of 0.23%), Immigrants from Northern Africa (16.0%, a difference of 0.24%), and Colombian (16.1%, a difference of 0.58%).
| Demographics | Rating | Rank | Child Poverty Among Boys Under 16 |
| French Canadians | 76.6 /100 | #155 | Good 15.9% |
| Israelis | 76.5 /100 | #156 | Good 15.9% |
| Immigrants | Nepal | 76.0 /100 | #157 | Good 15.9% |
| Yugoslavians | 75.9 /100 | #158 | Good 15.9% |
| Immigrants | Chile | 74.8 /100 | #159 | Good 15.9% |
| Immigrants | Northern Africa | 71.3 /100 | #160 | Good 16.0% |
| Immigrants | Oceania | 71.3 /100 | #161 | Good 16.0% |
| Guamanians/Chamorros | 69.6 /100 | #162 | Good 16.1% |
| Costa Ricans | 68.1 /100 | #163 | Good 16.1% |
| Immigrants | Albania | 67.9 /100 | #164 | Good 16.1% |
| Colombians | 65.2 /100 | #165 | Good 16.1% |
| Immigrants | Germany | 63.6 /100 | #166 | Good 16.2% |
| Afghans | 55.4 /100 | #167 | Average 16.3% |
| South Americans | 55.3 /100 | #168 | Average 16.3% |
| Immigrants | Saudi Arabia | 53.6 /100 | #169 | Average 16.4% |