Immigrants from Serbia vs Somali Family Poverty
COMPARE
Immigrants from Serbia
Somali
Family Poverty
Family Poverty Comparison
Immigrants from Serbia
Somalis
7.7%
FAMILY POVERTY
98.7/ 100
METRIC RATING
56th/ 347
METRIC RANK
11.2%
FAMILY POVERTY
0.1/ 100
METRIC RATING
273rd/ 347
METRIC RANK
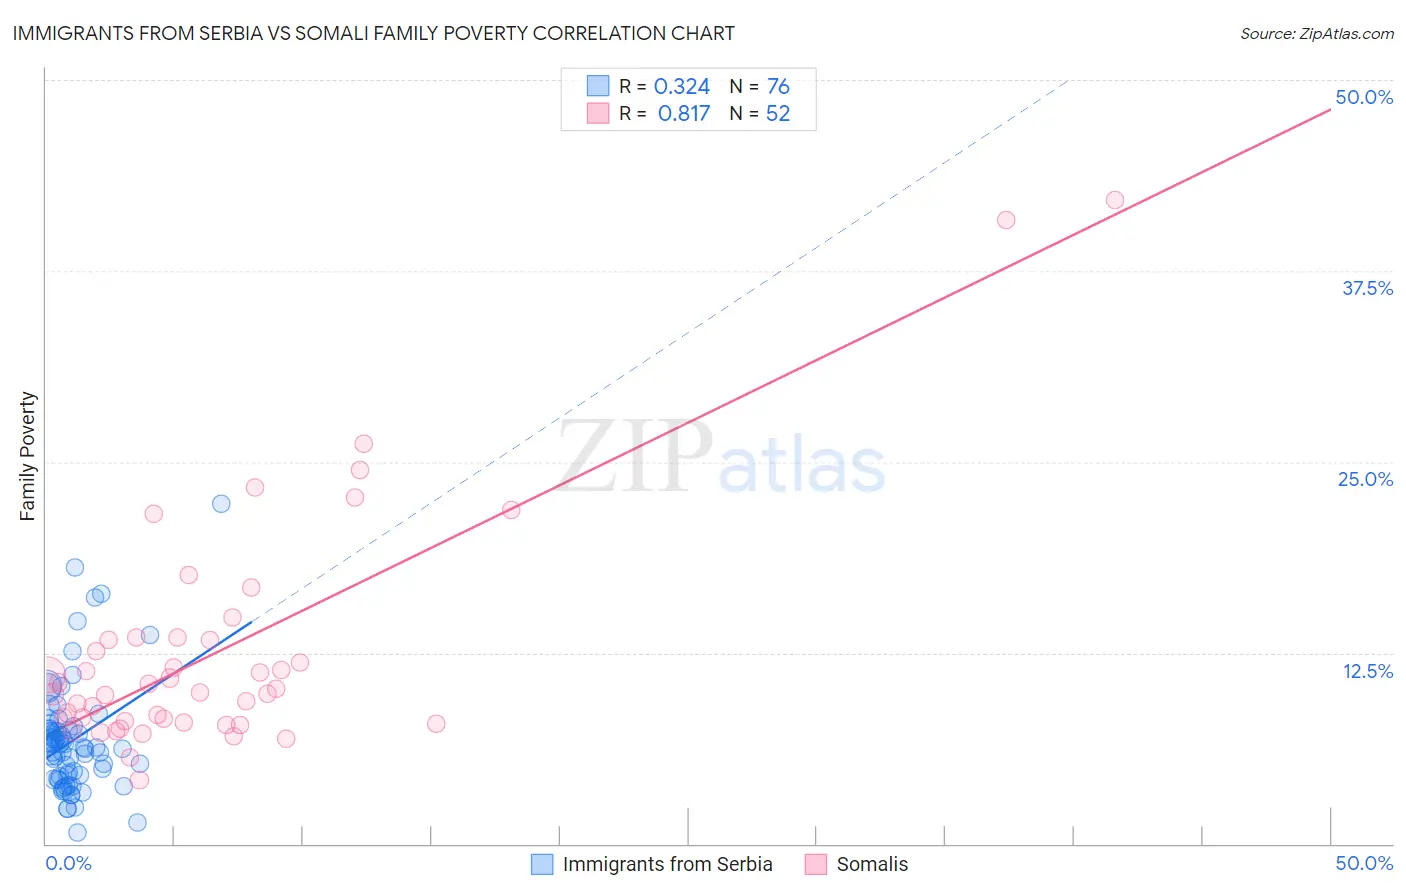
Immigrants from Serbia vs Somali Family Poverty Correlation Chart
The statistical analysis conducted on geographies consisting of 131,659,331 people shows a mild positive correlation between the proportion of Immigrants from Serbia and poverty level among families in the United States with a correlation coefficient (R) of 0.324 and weighted average of 7.7%. Similarly, the statistical analysis conducted on geographies consisting of 99,253,282 people shows a very strong positive correlation between the proportion of Somalis and poverty level among families in the United States with a correlation coefficient (R) of 0.817 and weighted average of 11.2%, a difference of 45.2%.
Family Poverty Correlation Summary
| Measurement | Immigrants from Serbia | Somali |
| Minimum | 0.76% | 4.2% |
| Maximum | 22.2% | 42.2% |
| Range | 21.5% | 38.0% |
| Mean | 6.8% | 12.6% |
| Median | 6.3% | 10.0% |
| Interquartile 25% (IQ1) | 4.3% | 8.0% |
| Interquartile 75% (IQ3) | 7.5% | 13.4% |
| Interquartile Range (IQR) | 3.2% | 5.5% |
| Standard Deviation (Sample) | 3.8% | 7.7% |
| Standard Deviation (Population) | 3.8% | 7.7% |
Similar Demographics by Family Poverty
Demographics Similar to Immigrants from Serbia by Family Poverty
In terms of family poverty, the demographic groups most similar to Immigrants from Serbia are Immigrants from Eastern Asia (7.7%, a difference of 0.040%), Immigrants from Sweden (7.7%, a difference of 0.070%), Swiss (7.7%, a difference of 0.080%), Asian (7.7%, a difference of 0.090%), and Finnish (7.7%, a difference of 0.12%).
| Demographics | Rating | Rank | Family Poverty |
| Immigrants | Bolivia | 98.9 /100 | #49 | Exceptional 7.7% |
| Immigrants | North Macedonia | 98.9 /100 | #50 | Exceptional 7.7% |
| Immigrants | Moldova | 98.8 /100 | #51 | Exceptional 7.7% |
| Indians (Asian) | 98.8 /100 | #52 | Exceptional 7.7% |
| Swiss | 98.8 /100 | #53 | Exceptional 7.7% |
| Immigrants | Sweden | 98.8 /100 | #54 | Exceptional 7.7% |
| Immigrants | Eastern Asia | 98.7 /100 | #55 | Exceptional 7.7% |
| Immigrants | Serbia | 98.7 /100 | #56 | Exceptional 7.7% |
| Asians | 98.7 /100 | #57 | Exceptional 7.7% |
| Finns | 98.7 /100 | #58 | Exceptional 7.7% |
| Europeans | 98.7 /100 | #59 | Exceptional 7.7% |
| Immigrants | Greece | 98.7 /100 | #60 | Exceptional 7.7% |
| Immigrants | Netherlands | 98.6 /100 | #61 | Exceptional 7.7% |
| Macedonians | 98.6 /100 | #62 | Exceptional 7.8% |
| Zimbabweans | 98.4 /100 | #63 | Exceptional 7.8% |
Demographics Similar to Somalis by Family Poverty
In terms of family poverty, the demographic groups most similar to Somalis are Spanish American (11.2%, a difference of 0.090%), Central American (11.2%, a difference of 0.13%), Immigrants from Guyana (11.2%, a difference of 0.16%), Chippewa (11.2%, a difference of 0.25%), and Guyanese (11.2%, a difference of 0.28%).
| Demographics | Rating | Rank | Family Poverty |
| Immigrants | El Salvador | 0.1 /100 | #266 | Tragic 11.0% |
| Comanche | 0.1 /100 | #267 | Tragic 11.0% |
| Jamaicans | 0.1 /100 | #268 | Tragic 11.1% |
| Immigrants | Ecuador | 0.1 /100 | #269 | Tragic 11.1% |
| Immigrants | Nicaragua | 0.1 /100 | #270 | Tragic 11.1% |
| Immigrants | Bahamas | 0.1 /100 | #271 | Tragic 11.1% |
| Immigrants | Jamaica | 0.1 /100 | #272 | Tragic 11.2% |
| Somalis | 0.1 /100 | #273 | Tragic 11.2% |
| Spanish Americans | 0.1 /100 | #274 | Tragic 11.2% |
| Central Americans | 0.1 /100 | #275 | Tragic 11.2% |
| Immigrants | Guyana | 0.1 /100 | #276 | Tragic 11.2% |
| Chippewa | 0.1 /100 | #277 | Tragic 11.2% |
| Guyanese | 0.1 /100 | #278 | Tragic 11.2% |
| Blackfeet | 0.0 /100 | #279 | Tragic 11.3% |
| Belizeans | 0.0 /100 | #280 | Tragic 11.3% |