Immigrants from Serbia vs Romanian Female Poverty Among 25-34 Year Olds
COMPARE
Immigrants from Serbia
Romanian
Female Poverty Among 25-34 Year Olds
Female Poverty Among 25-34 Year Olds Comparison
Immigrants from Serbia
Romanians
11.9%
FEMALE POVERTY AMONG 25-34 YEAR OLDS
99.7/ 100
METRIC RATING
46th/ 347
METRIC RANK
12.8%
FEMALE POVERTY AMONG 25-34 YEAR OLDS
92.8/ 100
METRIC RATING
121st/ 347
METRIC RANK
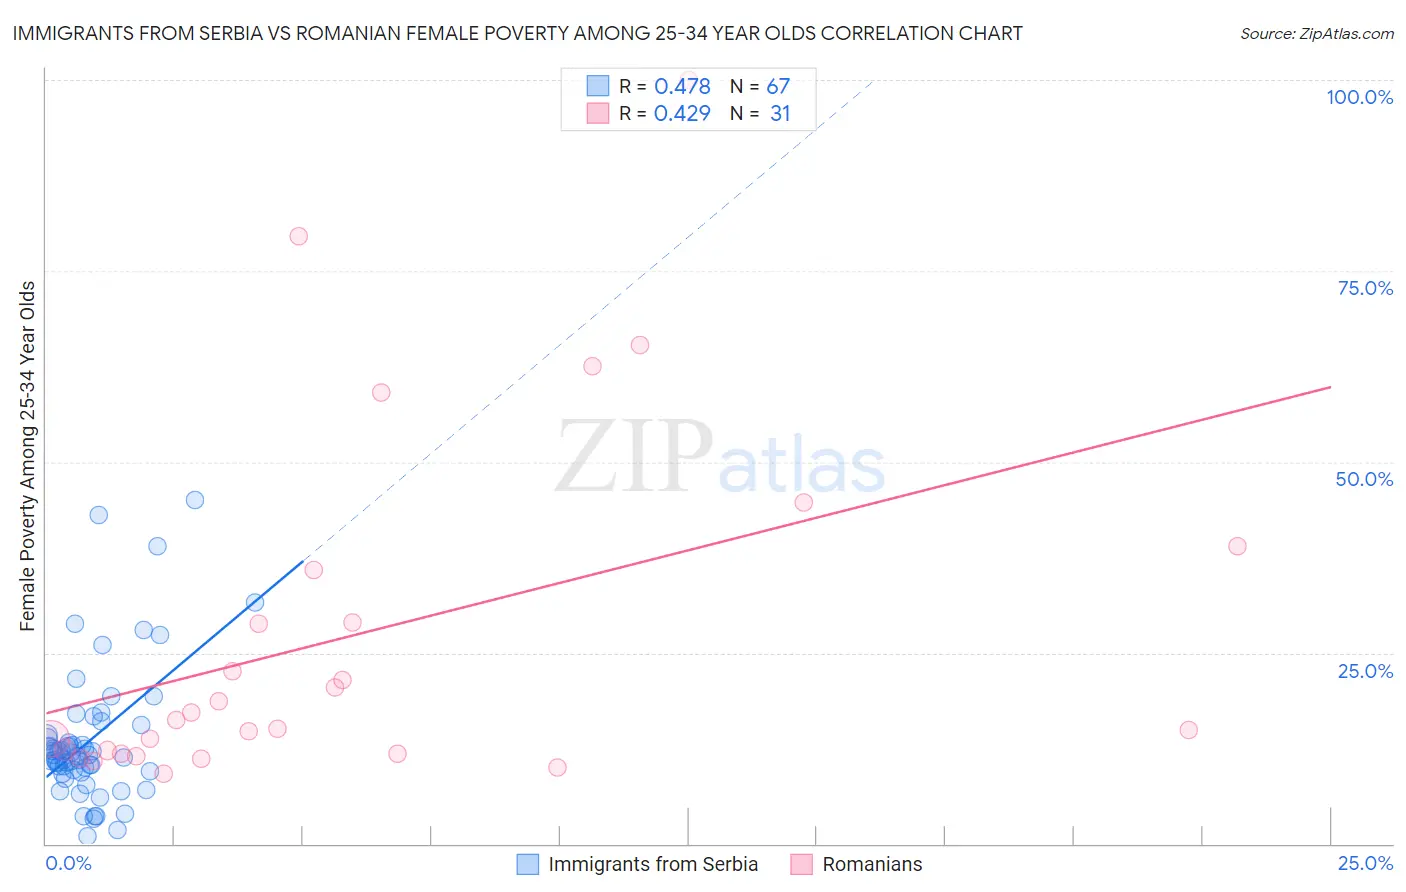
Immigrants from Serbia vs Romanian Female Poverty Among 25-34 Year Olds Correlation Chart
The statistical analysis conducted on geographies consisting of 130,855,081 people shows a moderate positive correlation between the proportion of Immigrants from Serbia and poverty level among females between the ages 25 and 34 in the United States with a correlation coefficient (R) of 0.478 and weighted average of 11.9%. Similarly, the statistical analysis conducted on geographies consisting of 370,877,474 people shows a moderate positive correlation between the proportion of Romanians and poverty level among females between the ages 25 and 34 in the United States with a correlation coefficient (R) of 0.429 and weighted average of 12.8%, a difference of 7.3%.
Female Poverty Among 25-34 Year Olds Correlation Summary
| Measurement | Immigrants from Serbia | Romanian |
| Minimum | 0.98% | 9.2% |
| Maximum | 45.0% | 100.0% |
| Range | 44.0% | 90.8% |
| Mean | 13.5% | 27.2% |
| Median | 11.5% | 16.2% |
| Interquartile 25% (IQ1) | 9.4% | 11.8% |
| Interquartile 75% (IQ3) | 14.2% | 35.8% |
| Interquartile Range (IQR) | 4.7% | 24.0% |
| Standard Deviation (Sample) | 8.8% | 23.1% |
| Standard Deviation (Population) | 8.7% | 22.8% |
Similar Demographics by Female Poverty Among 25-34 Year Olds
Demographics Similar to Immigrants from Serbia by Female Poverty Among 25-34 Year Olds
In terms of female poverty among 25-34 year olds, the demographic groups most similar to Immigrants from Serbia are Macedonian (11.9%, a difference of 0.010%), Korean (12.0%, a difference of 0.16%), Immigrants from Belarus (12.0%, a difference of 0.22%), Immigrants from Australia (11.9%, a difference of 0.27%), and Egyptian (11.9%, a difference of 0.29%).
| Demographics | Rating | Rank | Female Poverty Among 25-34 Year Olds |
| Latvians | 99.8 /100 | #39 | Exceptional 11.8% |
| Immigrants | Bulgaria | 99.8 /100 | #40 | Exceptional 11.8% |
| Immigrants | Indonesia | 99.8 /100 | #41 | Exceptional 11.8% |
| Immigrants | Turkey | 99.7 /100 | #42 | Exceptional 11.9% |
| Egyptians | 99.7 /100 | #43 | Exceptional 11.9% |
| Immigrants | Australia | 99.7 /100 | #44 | Exceptional 11.9% |
| Macedonians | 99.7 /100 | #45 | Exceptional 11.9% |
| Immigrants | Serbia | 99.7 /100 | #46 | Exceptional 11.9% |
| Koreans | 99.6 /100 | #47 | Exceptional 12.0% |
| Immigrants | Belarus | 99.6 /100 | #48 | Exceptional 12.0% |
| Immigrants | Egypt | 99.6 /100 | #49 | Exceptional 12.0% |
| Immigrants | Croatia | 99.6 /100 | #50 | Exceptional 12.0% |
| Paraguayans | 99.6 /100 | #51 | Exceptional 12.0% |
| Immigrants | Eastern Europe | 99.6 /100 | #52 | Exceptional 12.0% |
| Immigrants | Israel | 99.6 /100 | #53 | Exceptional 12.0% |
Demographics Similar to Romanians by Female Poverty Among 25-34 Year Olds
In terms of female poverty among 25-34 year olds, the demographic groups most similar to Romanians are Immigrants from Western Asia (12.8%, a difference of 0.020%), Slovene (12.8%, a difference of 0.030%), Immigrants from Nepal (12.8%, a difference of 0.070%), Carpatho Rusyn (12.8%, a difference of 0.070%), and Mongolian (12.8%, a difference of 0.080%).
| Demographics | Rating | Rank | Female Poverty Among 25-34 Year Olds |
| Immigrants | Southern Europe | 93.6 /100 | #114 | Exceptional 12.8% |
| Immigrants | Brazil | 93.3 /100 | #115 | Exceptional 12.8% |
| Chileans | 93.2 /100 | #116 | Exceptional 12.8% |
| Immigrants | Kuwait | 93.1 /100 | #117 | Exceptional 12.8% |
| Mongolians | 93.0 /100 | #118 | Exceptional 12.8% |
| Immigrants | Nepal | 93.0 /100 | #119 | Exceptional 12.8% |
| Carpatho Rusyns | 93.0 /100 | #120 | Exceptional 12.8% |
| Romanians | 92.8 /100 | #121 | Exceptional 12.8% |
| Immigrants | Western Asia | 92.7 /100 | #122 | Exceptional 12.8% |
| Slovenes | 92.7 /100 | #123 | Exceptional 12.8% |
| Immigrants | Netherlands | 92.0 /100 | #124 | Exceptional 12.8% |
| Immigrants | Canada | 91.5 /100 | #125 | Exceptional 12.9% |
| Immigrants | Fiji | 91.2 /100 | #126 | Exceptional 12.9% |
| Czechs | 90.3 /100 | #127 | Exceptional 12.9% |
| Syrians | 90.2 /100 | #128 | Exceptional 12.9% |