Immigrants from Serbia vs Immigrants from Burma/Myanmar Poverty
COMPARE
Immigrants from Serbia
Immigrants from Burma/Myanmar
Poverty
Poverty Comparison
Immigrants from Serbia
Immigrants from Burma/Myanmar
11.1%
POVERTY
98.5/ 100
METRIC RATING
55th/ 347
METRIC RANK
14.2%
POVERTY
0.2/ 100
METRIC RATING
251st/ 347
METRIC RANK
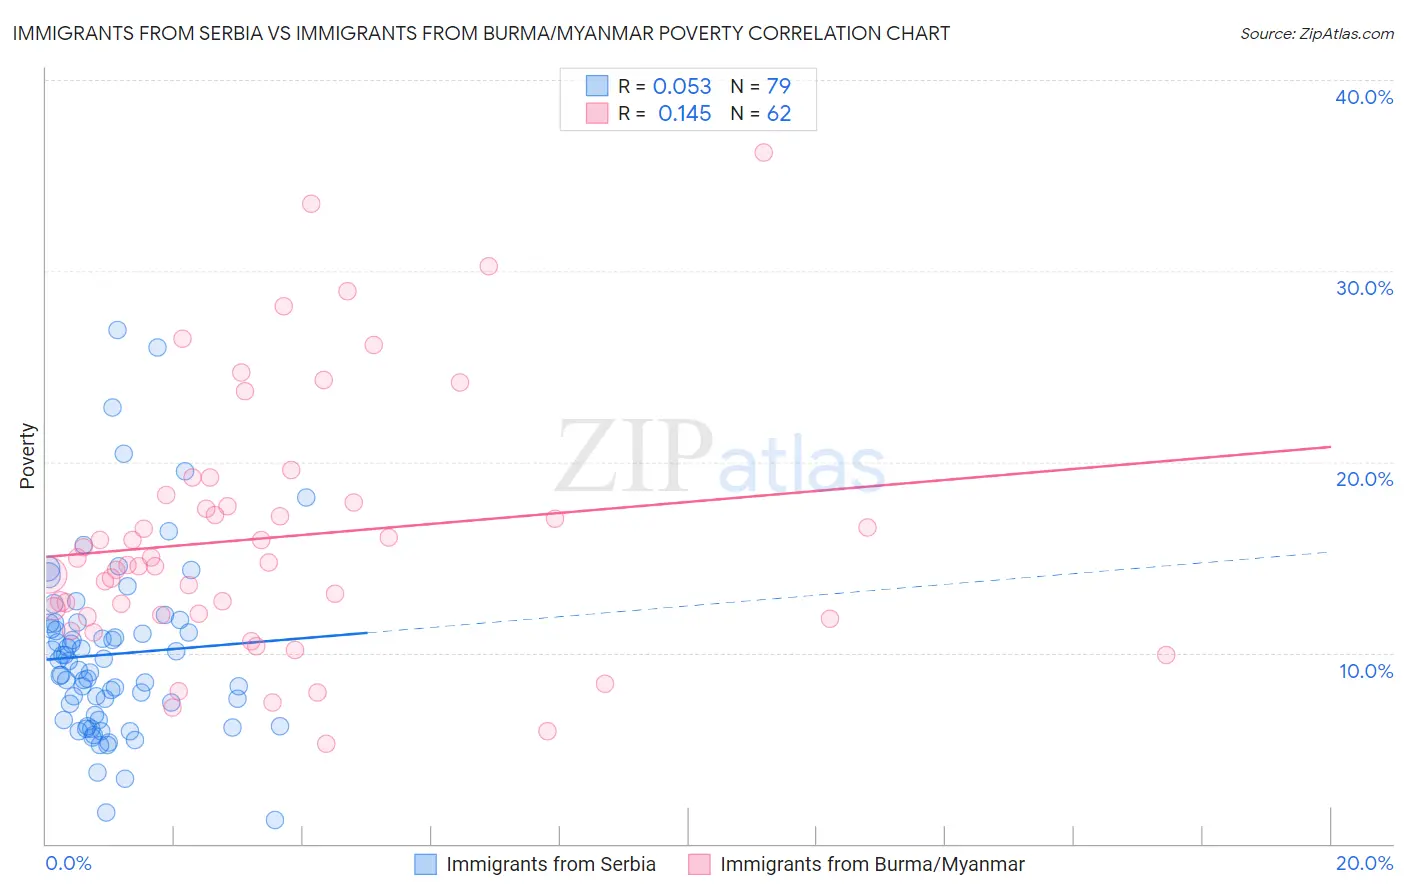
Immigrants from Serbia vs Immigrants from Burma/Myanmar Poverty Correlation Chart
The statistical analysis conducted on geographies consisting of 131,733,920 people shows a slight positive correlation between the proportion of Immigrants from Serbia and poverty level in the United States with a correlation coefficient (R) of 0.053 and weighted average of 11.1%. Similarly, the statistical analysis conducted on geographies consisting of 172,278,151 people shows a poor positive correlation between the proportion of Immigrants from Burma/Myanmar and poverty level in the United States with a correlation coefficient (R) of 0.145 and weighted average of 14.2%, a difference of 28.4%.
Poverty Correlation Summary
| Measurement | Immigrants from Serbia | Immigrants from Burma/Myanmar |
| Minimum | 1.3% | 5.2% |
| Maximum | 26.9% | 36.2% |
| Range | 25.6% | 31.0% |
| Mean | 9.9% | 16.0% |
| Median | 9.1% | 14.7% |
| Interquartile 25% (IQ1) | 6.5% | 12.0% |
| Interquartile 75% (IQ3) | 11.5% | 17.9% |
| Interquartile Range (IQR) | 5.1% | 5.9% |
| Standard Deviation (Sample) | 4.7% | 6.6% |
| Standard Deviation (Population) | 4.7% | 6.6% |
Similar Demographics by Poverty
Demographics Similar to Immigrants from Serbia by Poverty
In terms of poverty, the demographic groups most similar to Immigrants from Serbia are Immigrants from Bulgaria (11.1%, a difference of 0.030%), Immigrants from Austria (11.1%, a difference of 0.15%), Immigrants from Philippines (11.0%, a difference of 0.37%), Immigrants from Croatia (11.0%, a difference of 0.39%), and Estonian (11.1%, a difference of 0.48%).
| Demographics | Rating | Rank | Poverty |
| Slovenes | 98.9 /100 | #48 | Exceptional 11.0% |
| Immigrants | Japan | 98.9 /100 | #49 | Exceptional 11.0% |
| Asians | 98.9 /100 | #50 | Exceptional 11.0% |
| Immigrants | Croatia | 98.7 /100 | #51 | Exceptional 11.0% |
| Immigrants | Philippines | 98.7 /100 | #52 | Exceptional 11.0% |
| Immigrants | Austria | 98.6 /100 | #53 | Exceptional 11.1% |
| Immigrants | Bulgaria | 98.5 /100 | #54 | Exceptional 11.1% |
| Immigrants | Serbia | 98.5 /100 | #55 | Exceptional 11.1% |
| Estonians | 98.2 /100 | #56 | Exceptional 11.1% |
| Scandinavians | 98.2 /100 | #57 | Exceptional 11.1% |
| Germans | 98.1 /100 | #58 | Exceptional 11.1% |
| Immigrants | Europe | 98.0 /100 | #59 | Exceptional 11.2% |
| Immigrants | Sri Lanka | 97.9 /100 | #60 | Exceptional 11.2% |
| Immigrants | Italy | 97.9 /100 | #61 | Exceptional 11.2% |
| Austrians | 97.8 /100 | #62 | Exceptional 11.2% |
Demographics Similar to Immigrants from Burma/Myanmar by Poverty
In terms of poverty, the demographic groups most similar to Immigrants from Burma/Myanmar are Cree (14.2%, a difference of 0.090%), Spanish American Indian (14.2%, a difference of 0.11%), Immigrants from Trinidad and Tobago (14.2%, a difference of 0.22%), Immigrants from Ghana (14.2%, a difference of 0.39%), and Immigrants from El Salvador (14.3%, a difference of 0.47%).
| Demographics | Rating | Rank | Poverty |
| Nepalese | 0.3 /100 | #244 | Tragic 14.0% |
| Immigrants | Sudan | 0.3 /100 | #245 | Tragic 14.1% |
| Potawatomi | 0.3 /100 | #246 | Tragic 14.1% |
| Liberians | 0.2 /100 | #247 | Tragic 14.1% |
| Immigrants | Western Africa | 0.2 /100 | #248 | Tragic 14.1% |
| Immigrants | Ghana | 0.2 /100 | #249 | Tragic 14.2% |
| Cree | 0.2 /100 | #250 | Tragic 14.2% |
| Immigrants | Burma/Myanmar | 0.2 /100 | #251 | Tragic 14.2% |
| Spanish American Indians | 0.2 /100 | #252 | Tragic 14.2% |
| Immigrants | Trinidad and Tobago | 0.2 /100 | #253 | Tragic 14.2% |
| Immigrants | El Salvador | 0.1 /100 | #254 | Tragic 14.3% |
| Immigrants | Ecuador | 0.1 /100 | #255 | Tragic 14.3% |
| Mexican American Indians | 0.1 /100 | #256 | Tragic 14.3% |
| Trinidadians and Tobagonians | 0.1 /100 | #257 | Tragic 14.3% |
| Ottawa | 0.1 /100 | #258 | Tragic 14.3% |