Immigrants from Senegal vs Immigrants from Cameroon Single Male Poverty

COMPARE

Immigrants from Senegal
Race
Ancestry
AfghanAfricanAlaska NativeAlaskan AthabascanAlbanianAleutAlsatianAmericanApacheArabArapahoArgentineanArmenianAssyrian/Chaldean/SyriacAustralianAustrianBahamianBangladeshiBarbadianBasqueBelgianBelizeanBermudanBhutaneseBlackfeetBolivianBrazilianBritishBritish West IndianBulgarianBurmeseCajunCambodianCanadianCape VerdeanCarpatho RusynCelticCentral AmericanCentral American IndianCherokeeCheyenneChickasawChileanChineseChippewaChoctawColombianColvilleComancheCosta RicanCreeCreekCroatianCrowCubanCypriotCzechCzechoslovakianDanishDelawareDominicanDutchDutch West IndianEastern EuropeanEcuadorianEgyptianEnglishEstonianEthiopianEuropeanFijianFilipinoFinnishFrenchFrench American IndianFrench CanadianGermanGerman RussianGhanaianGreekGuamanian/ChamorroGuatemalanGuyaneseHaitianHmongHonduranHopiHoumaHungarianIcelanderIndian (Asian)IndonesianInupiatIranianIraqiIrishIroquoisIsraeliItalianJamaicanJapaneseJordanianKenyanKiowaKoreanLaotianLatvianLebaneseLiberianLithuanianLumbeeLuxembourgerMacedonianMalaysianMalteseMarshalleseMenomineeMexicanMexican American IndianMongolianMoroccanNative HawaiianNavajoNepaleseNew ZealanderNicaraguanNigerianNorthern EuropeanNorwegianOkinawanOsageOttawaPaiutePakistaniPalestinianPanamanianParaguayanPennsylvania GermanPeruvianPimaPolishPortuguesePotawatomiPuebloPuerto RicanPuget Sound SalishRomanianRussianSalvadoranSamoanScandinavianScotch-IrishScottishSeminoleSenegaleseSerbianShoshoneSierra LeoneanSiouxSlavicSlovakSloveneSomaliSouth AfricanSouth AmericanSouth American IndianSoviet UnionSpaniardSpanishSpanish AmericanSpanish American IndianSri LankanSubsaharan AfricanSudaneseSwedishSwissSyrianTaiwaneseThaiTlingit-HaidaTohono O'OdhamTonganTrinidadian and TobagonianTsimshianTurkishU.S. Virgin IslanderUgandanUkrainianUruguayanUteVenezuelanVietnameseWelshWest IndianYakamaYaquiYugoslavianYumanYup'ikZimbabwean
Immigration
NonimmigrantsImmigrantsAfghanistanAfricaAlbaniaArgentinaArmeniaAsiaAustraliaAustriaBahamasBangladeshBarbadosBelarusBelgiumBelizeBoliviaBosnia and HerzegovinaBrazilBulgariaBurma/MyanmarCabo VerdeCambodiaCanadaCaribbeanCentral AmericaChileChinaColombiaCongoCosta RicaCroatiaCubaCzechoslovakiaDenmarkDominicaDominican RepublicEastern AfricaEastern AsiaEastern EuropeEcuadorEgyptEl SalvadorEnglandEritreaEthiopiaEuropeFijiFranceGermanyGhanaGreeceGrenadaGuatemalaGuyanaHaitiHondurasHong KongHungaryIndiaIndonesiaIranIraqIrelandIsraelItalyJamaicaJapanJordanKazakhstanKenyaKoreaKuwaitLaosLatin AmericaLatviaLebanonLiberiaLithuaniaMalaysiaMexicoMicronesiaMiddle AfricaMoldovaMoroccoNepalNetherlandsNicaraguaNigeriaNorth AmericaNorth MacedoniaNorthern AfricaNorthern EuropeNorwayOceaniaPakistanPanamaPeruPhilippinesPolandPortugalRomaniaRussiaSaudi ArabiaScotlandSenegalSerbiaSierra LeoneSingaporeSomaliaSouth AfricaSouth AmericaSouth Central AsiaSouth Eastern AsiaSouthern EuropeSpainSri LankaSt. Vincent and the GrenadinesSudanSwedenSwitzerlandSyriaTaiwanThailandTrinidad and TobagoTurkeyUgandaUkraineUruguayUzbekistanVenezuelaVietnamWest IndiesWestern AfricaWestern AsiaWestern EuropeYemenZaireZimbabweAzores
Immigrants from Cameroon
Race
Ancestry
AfghanAfricanAlaska NativeAlaskan AthabascanAlbanianAleutAlsatianAmericanApacheArabArapahoArgentineanArmenianAssyrian/Chaldean/SyriacAustralianAustrianBahamianBangladeshiBarbadianBasqueBelgianBelizeanBermudanBhutaneseBlackfeetBolivianBrazilianBritishBritish West IndianBulgarianBurmeseCajunCambodianCanadianCape VerdeanCarpatho RusynCelticCentral AmericanCentral American IndianCherokeeCheyenneChickasawChileanChineseChippewaChoctawColombianColvilleComancheCosta RicanCreeCreekCroatianCrowCubanCypriotCzechCzechoslovakianDanishDelawareDominicanDutchDutch West IndianEastern EuropeanEcuadorianEgyptianEnglishEstonianEthiopianEuropeanFijianFilipinoFinnishFrenchFrench American IndianFrench CanadianGermanGerman RussianGhanaianGreekGuamanian/ChamorroGuatemalanGuyaneseHaitianHmongHonduranHopiHoumaHungarianIcelanderIndian (Asian)IndonesianInupiatIranianIraqiIrishIroquoisIsraeliItalianJamaicanJapaneseJordanianKenyanKiowaKoreanLaotianLatvianLebaneseLiberianLithuanianLumbeeLuxembourgerMacedonianMalaysianMalteseMarshalleseMenomineeMexicanMexican American IndianMongolianMoroccanNative HawaiianNavajoNepaleseNew ZealanderNicaraguanNigerianNorthern EuropeanNorwegianOkinawanOsageOttawaPaiutePakistaniPalestinianPanamanianParaguayanPennsylvania GermanPeruvianPimaPolishPortuguesePotawatomiPuebloPuerto RicanPuget Sound SalishRomanianRussianSalvadoranSamoanScandinavianScotch-IrishScottishSeminoleSenegaleseSerbianShoshoneSierra LeoneanSiouxSlavicSlovakSloveneSomaliSouth AfricanSouth AmericanSouth American IndianSoviet UnionSpaniardSpanishSpanish AmericanSpanish American IndianSri LankanSubsaharan AfricanSudaneseSwedishSwissSyrianTaiwaneseThaiTlingit-HaidaTohono O'OdhamTonganTrinidadian and TobagonianTsimshianTurkishU.S. Virgin IslanderUgandanUkrainianUruguayanUteVenezuelanVietnameseWelshWest IndianYakamaYaquiYugoslavianYumanYup'ikZimbabwean
Immigration
NonimmigrantsImmigrantsAfghanistanAfricaAlbaniaArgentinaArmeniaAsiaAustraliaAustriaBahamasBangladeshBarbadosBelarusBelgiumBelizeBoliviaBosnia and HerzegovinaBrazilBulgariaBurma/MyanmarCabo VerdeCambodiaCameroonCanadaCaribbeanCentral AmericaChileChinaColombiaCongoCosta RicaCroatiaCubaCzechoslovakiaDenmarkDominicaDominican RepublicEastern AfricaEastern AsiaEastern EuropeEcuadorEgyptEl SalvadorEnglandEritreaEthiopiaEuropeFijiFranceGermanyGhanaGreeceGrenadaGuatemalaGuyanaHaitiHondurasHong KongHungaryIndiaIndonesiaIranIraqIrelandIsraelItalyJamaicaJapanJordanKazakhstanKenyaKoreaKuwaitLaosLatin AmericaLatviaLebanonLiberiaLithuaniaMalaysiaMexicoMicronesiaMiddle AfricaMoldovaMoroccoNepalNetherlandsNicaraguaNigeriaNorth AmericaNorth MacedoniaNorthern AfricaNorthern EuropeNorwayOceaniaPakistanPanamaPeruPhilippinesPolandPortugalRomaniaRussiaSaudi ArabiaScotlandSerbiaSierra LeoneSingaporeSomaliaSouth AfricaSouth AmericaSouth Central AsiaSouth Eastern AsiaSouthern EuropeSpainSri LankaSt. Vincent and the GrenadinesSudanSwedenSwitzerlandSyriaTaiwanThailandTrinidad and TobagoTurkeyUgandaUkraineUruguayUzbekistanVenezuelaVietnamWest IndiesWestern AfricaWestern AsiaWestern EuropeYemenZaireZimbabweAzores
Single Male Poverty
Income
Poverty
Unemployment
Labor Participation
Family Structure
Vehicle Availability
Education Level
Disability

Single Male Poverty Comparison

Immigrants from Senegal

Immigrants from Cameroon

Tragic
Exceptional
13.5%
SINGLE MALE POVERTY
1.7/ 100
METRIC RATING
244th/ 347
METRIC RANK
11.5%
SINGLE MALE POVERTY
99.9/ 100
METRIC RATING
44th/ 347
METRIC RANK

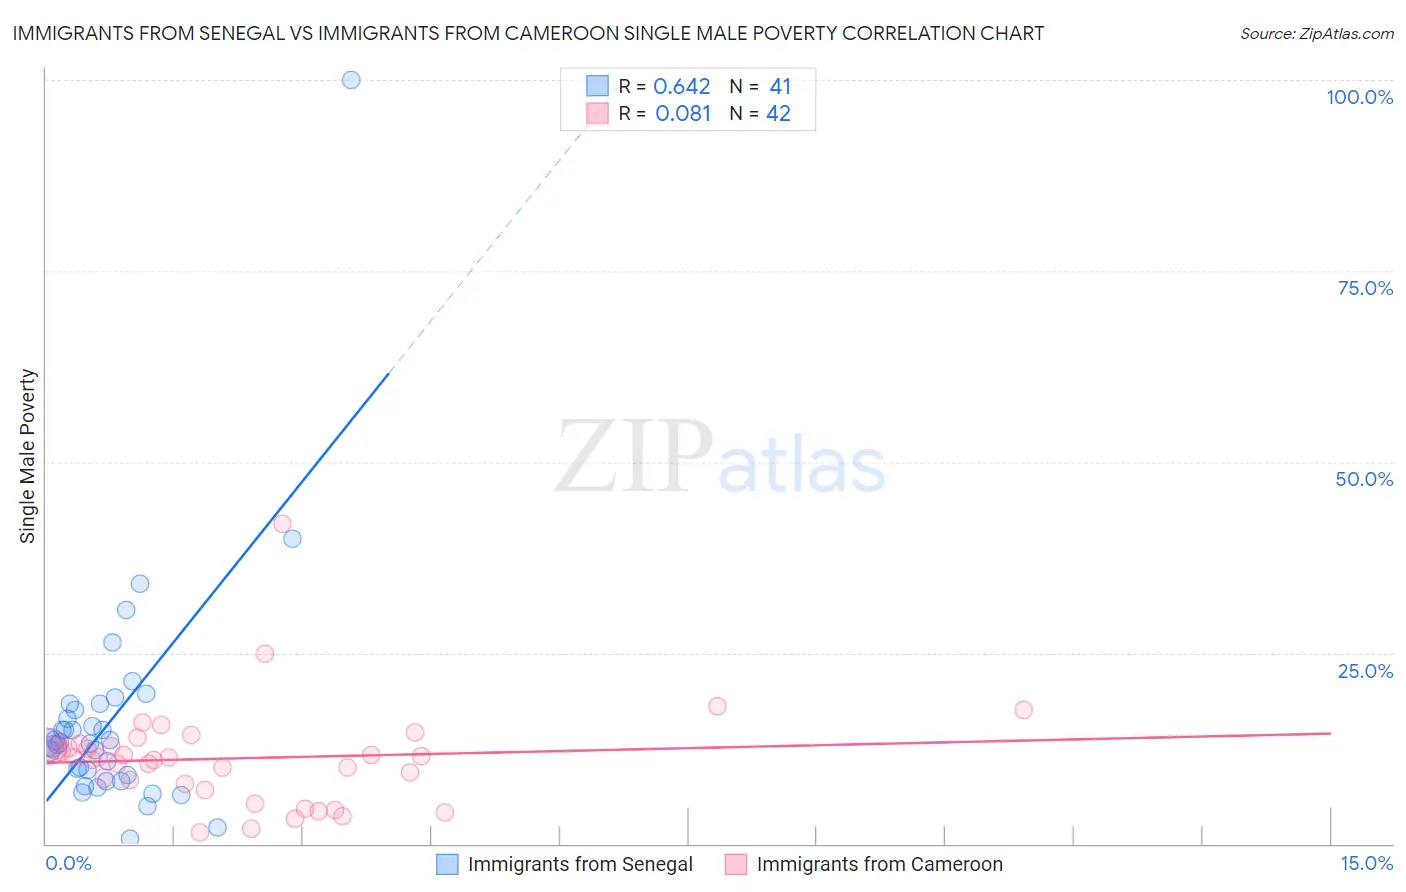
Immigrants from Senegal vs Immigrants from Cameroon Single Male Poverty Correlation Chart

The statistical analysis conducted on geographies consisting of 87,233,263 people shows a significant positive correlation between the proportion of Immigrants from Senegal and poverty level among single males in the United States with a correlation coefficient (R) of 0.642 and weighted average of 13.5%. Similarly, the statistical analysis conducted on geographies consisting of 124,431,702 people shows a slight positive correlation between the proportion of Immigrants from Cameroon and poverty level among single males in the United States with a correlation coefficient (R) of 0.081 and weighted average of 11.5%, a difference of 16.8%.
Immigrants from Senegal vs Immigrants from Cameroon Single Male Poverty

Single Male Poverty Correlation Summary

MeasurementImmigrants from SenegalImmigrants from Cameroon
Minimum0.68%1.5%
Maximum100.0%41.9%
Range99.3%40.4%
Mean16.1%11.2%
Median13.2%11.3%
Interquartile 25% (IQ1)8.6%7.8%
Interquartile 75% (IQ3)17.9%12.8%
Interquartile Range (IQR)9.3%5.0%
Standard Deviation (Sample)15.6%6.8%
Standard Deviation (Population)15.4%6.7%

Similar Demographics by Single Male Poverty

Demographics Similar to Immigrants from Senegal by Single Male Poverty

In terms of single male poverty, the demographic groups most similar to Immigrants from Senegal are Immigrants from Latin America (13.5%, a difference of 0.26%), Barbadian (13.4%, a difference of 0.28%), Carpatho Rusyn (13.4%, a difference of 0.32%), Immigrants from Germany (13.4%, a difference of 0.33%), and Immigrants from Micronesia (13.5%, a difference of 0.36%).
DemographicsRating | RankSingle Male Poverty
British West Indians
3.4
/100
|
#237
Tragic
13.4%
Immigrants | Ghana
3.2
/100
|
#238
Tragic
13.4%
Czechoslovakians
3.0
/100
|
#239
Tragic
13.4%
Belizeans
2.3
/100
|
#240
Tragic
13.4%
Immigrants | Germany
2.1
/100
|
#241
Tragic
13.4%
Carpatho Rusyns
2.1
/100
|
#242
Tragic
13.4%
Barbadians
2.1
/100
|
#243
Tragic
13.4%
Immigrants | Senegal
1.7
/100
|
#244
Tragic
13.5%
Immigrants | Latin America
1.3
/100
|
#245
Tragic
13.5%
Immigrants | Micronesia
1.2
/100
|
#246
Tragic
13.5%
Belgians
1.2
/100
|
#247
Tragic
13.5%
Czechs
1.2
/100
|
#248
Tragic
13.5%
Spanish
1.0
/100
|
#249
Tragic
13.6%
Immigrants | Somalia
1.0
/100
|
#250
Tragic
13.6%
Immigrants | Zaire
0.9
/100
|
#251
Tragic
13.6%

Demographics Similar to Immigrants from Cameroon by Single Male Poverty

In terms of single male poverty, the demographic groups most similar to Immigrants from Cameroon are Immigrants from Peru (11.5%, a difference of 0.010%), Immigrants from Poland (11.5%, a difference of 0.020%), Immigrants from Bulgaria (11.6%, a difference of 0.15%), Egyptian (11.5%, a difference of 0.17%), and Immigrants from Iraq (11.5%, a difference of 0.22%).
DemographicsRating | RankSingle Male Poverty
Immigrants | Singapore
100.0
/100
|
#37
Exceptional
11.4%
Sri Lankans
100.0
/100
|
#38
Exceptional
11.5%
Soviet Union
100.0
/100
|
#39
Exceptional
11.5%
Immigrants | Korea
100.0
/100
|
#40
Exceptional
11.5%
Immigrants | Iraq
99.9
/100
|
#41
Exceptional
11.5%
Egyptians
99.9
/100
|
#42
Exceptional
11.5%
Immigrants | Peru
99.9
/100
|
#43
Exceptional
11.5%
Immigrants | Cameroon
99.9
/100
|
#44
Exceptional
11.5%
Immigrants | Poland
99.9
/100
|
#45
Exceptional
11.5%
Immigrants | Bulgaria
99.9
/100
|
#46
Exceptional
11.6%
Nepalese
99.9
/100
|
#47
Exceptional
11.6%
Immigrants | Indonesia
99.9
/100
|
#48
Exceptional
11.6%
Tlingit-Haida
99.9
/100
|
#49
Exceptional
11.6%
Immigrants | Lithuania
99.9
/100
|
#50
Exceptional
11.6%
Paraguayans
99.9
/100
|
#51
Exceptional
11.6%