Immigrants from Senegal vs Cheyenne Family Poverty
COMPARE
Immigrants from Senegal
Cheyenne
Family Poverty
Family Poverty Comparison
Immigrants from Senegal
Cheyenne
11.7%
FAMILY POVERTY
0.0/ 100
METRIC RATING
298th/ 347
METRIC RANK
14.3%
FAMILY POVERTY
0.0/ 100
METRIC RATING
331st/ 347
METRIC RANK
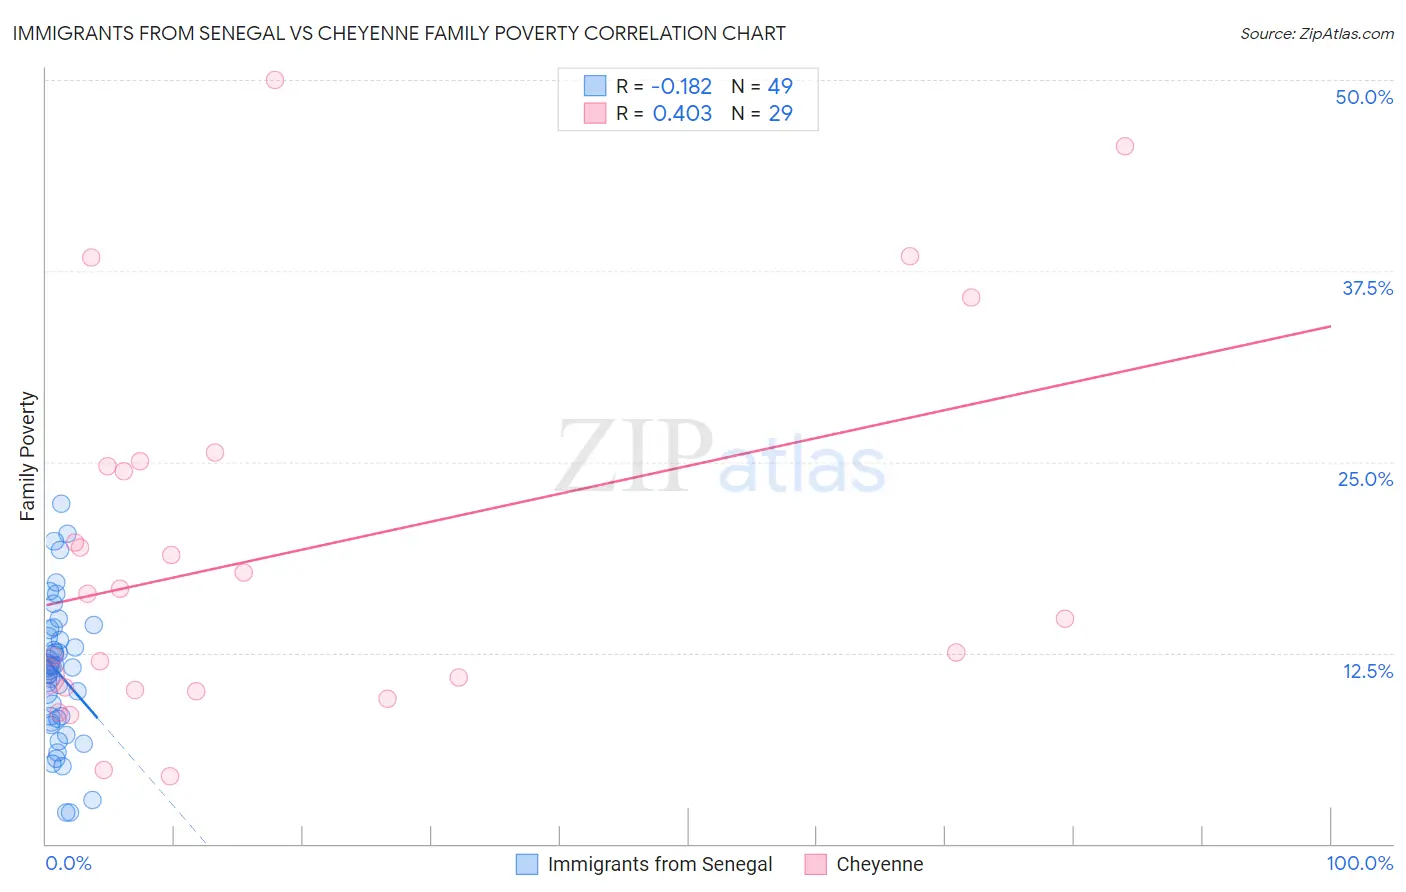
Immigrants from Senegal vs Cheyenne Family Poverty Correlation Chart
The statistical analysis conducted on geographies consisting of 90,075,938 people shows a poor negative correlation between the proportion of Immigrants from Senegal and poverty level among families in the United States with a correlation coefficient (R) of -0.182 and weighted average of 11.7%. Similarly, the statistical analysis conducted on geographies consisting of 80,652,371 people shows a moderate positive correlation between the proportion of Cheyenne and poverty level among families in the United States with a correlation coefficient (R) of 0.403 and weighted average of 14.3%, a difference of 22.4%.
Family Poverty Correlation Summary
| Measurement | Immigrants from Senegal | Cheyenne |
| Minimum | 2.0% | 4.4% |
| Maximum | 22.3% | 50.0% |
| Range | 20.2% | 45.6% |
| Mean | 11.2% | 19.2% |
| Median | 11.5% | 16.4% |
| Interquartile 25% (IQ1) | 8.1% | 10.1% |
| Interquartile 75% (IQ3) | 13.8% | 24.9% |
| Interquartile Range (IQR) | 5.7% | 14.7% |
| Standard Deviation (Sample) | 4.6% | 12.1% |
| Standard Deviation (Population) | 4.5% | 11.9% |
Similar Demographics by Family Poverty
Demographics Similar to Immigrants from Senegal by Family Poverty
In terms of family poverty, the demographic groups most similar to Immigrants from Senegal are Dutch West Indian (11.7%, a difference of 0.10%), Immigrants from Bangladesh (11.7%, a difference of 0.11%), Creek (11.7%, a difference of 0.14%), Bahamian (11.7%, a difference of 0.36%), and Choctaw (11.6%, a difference of 0.37%).
| Demographics | Rating | Rank | Family Poverty |
| Haitians | 0.0 /100 | #291 | Tragic 11.5% |
| Immigrants | Somalia | 0.0 /100 | #292 | Tragic 11.5% |
| Immigrants | Cabo Verde | 0.0 /100 | #293 | Tragic 11.6% |
| Immigrants | St. Vincent and the Grenadines | 0.0 /100 | #294 | Tragic 11.6% |
| Immigrants | Haiti | 0.0 /100 | #295 | Tragic 11.6% |
| Choctaw | 0.0 /100 | #296 | Tragic 11.6% |
| Creek | 0.0 /100 | #297 | Tragic 11.7% |
| Immigrants | Senegal | 0.0 /100 | #298 | Tragic 11.7% |
| Dutch West Indians | 0.0 /100 | #299 | Tragic 11.7% |
| Immigrants | Bangladesh | 0.0 /100 | #300 | Tragic 11.7% |
| Bahamians | 0.0 /100 | #301 | Tragic 11.7% |
| Guatemalans | 0.0 /100 | #302 | Tragic 11.7% |
| Africans | 0.0 /100 | #303 | Tragic 11.8% |
| Immigrants | Latin America | 0.0 /100 | #304 | Tragic 11.8% |
| Mexicans | 0.0 /100 | #305 | Tragic 11.8% |
Demographics Similar to Cheyenne by Family Poverty
In terms of family poverty, the demographic groups most similar to Cheyenne are Native/Alaskan (14.3%, a difference of 0.14%), Dominican (14.3%, a difference of 0.44%), Immigrants from Dominican Republic (14.4%, a difference of 1.1%), Houma (14.6%, a difference of 2.4%), and Apache (14.7%, a difference of 3.2%).
| Demographics | Rating | Rank | Family Poverty |
| Immigrants | Dominica | 0.0 /100 | #324 | Tragic 12.7% |
| Paiute | 0.0 /100 | #325 | Tragic 13.0% |
| Colville | 0.0 /100 | #326 | Tragic 13.0% |
| Yakama | 0.0 /100 | #327 | Tragic 13.1% |
| Central American Indians | 0.0 /100 | #328 | Tragic 13.3% |
| Blacks/African Americans | 0.0 /100 | #329 | Tragic 13.3% |
| Natives/Alaskans | 0.0 /100 | #330 | Tragic 14.3% |
| Cheyenne | 0.0 /100 | #331 | Tragic 14.3% |
| Dominicans | 0.0 /100 | #332 | Tragic 14.3% |
| Immigrants | Dominican Republic | 0.0 /100 | #333 | Tragic 14.4% |
| Houma | 0.0 /100 | #334 | Tragic 14.6% |
| Apache | 0.0 /100 | #335 | Tragic 14.7% |
| Sioux | 0.0 /100 | #336 | Tragic 15.9% |
| Hopi | 0.0 /100 | #337 | Tragic 15.9% |
| Crow | 0.0 /100 | #338 | Tragic 16.1% |