Immigrants from Scotland vs Immigrants from Canada Seniors Poverty Over the Age of 65
COMPARE
Immigrants from Scotland
Immigrants from Canada
Seniors Poverty Over the Age of 65
Seniors Poverty Over the Age of 65 Comparison
Immigrants from Scotland
Immigrants from Canada
9.3%
SENIORS POVERTY OVER THE AGE OF 65
99.9/ 100
METRIC RATING
26th/ 347
METRIC RANK
9.8%
SENIORS POVERTY OVER THE AGE OF 65
99.0/ 100
METRIC RATING
59th/ 347
METRIC RANK
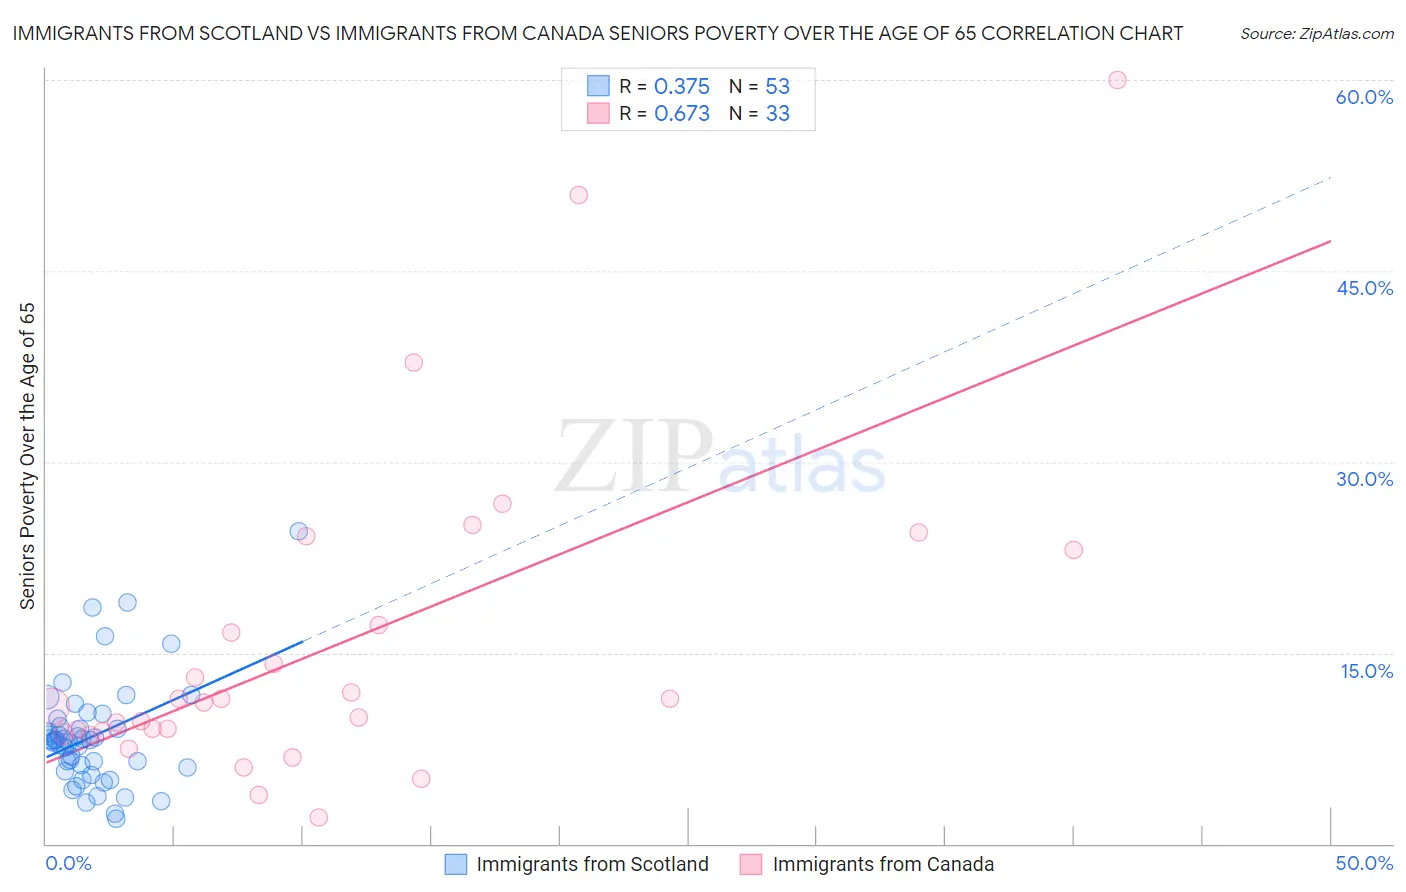
Immigrants from Scotland vs Immigrants from Canada Seniors Poverty Over the Age of 65 Correlation Chart
The statistical analysis conducted on geographies consisting of 196,224,492 people shows a mild positive correlation between the proportion of Immigrants from Scotland and poverty level among seniors over the age of 65 in the United States with a correlation coefficient (R) of 0.375 and weighted average of 9.3%. Similarly, the statistical analysis conducted on geographies consisting of 457,331,043 people shows a significant positive correlation between the proportion of Immigrants from Canada and poverty level among seniors over the age of 65 in the United States with a correlation coefficient (R) of 0.673 and weighted average of 9.8%, a difference of 5.7%.
Seniors Poverty Over the Age of 65 Correlation Summary
| Measurement | Immigrants from Scotland | Immigrants from Canada |
| Minimum | 2.0% | 2.1% |
| Maximum | 24.5% | 60.0% |
| Range | 22.5% | 57.9% |
| Mean | 8.4% | 15.6% |
| Median | 8.1% | 11.1% |
| Interquartile 25% (IQ1) | 5.8% | 8.7% |
| Interquartile 75% (IQ3) | 9.5% | 20.1% |
| Interquartile Range (IQR) | 3.7% | 11.4% |
| Standard Deviation (Sample) | 4.3% | 12.9% |
| Standard Deviation (Population) | 4.2% | 12.7% |
Similar Demographics by Seniors Poverty Over the Age of 65
Demographics Similar to Immigrants from Scotland by Seniors Poverty Over the Age of 65
In terms of seniors poverty over the age of 65, the demographic groups most similar to Immigrants from Scotland are Irish (9.3%, a difference of 0.030%), Italian (9.3%, a difference of 0.080%), Tongan (9.3%, a difference of 0.27%), Bulgarian (9.3%, a difference of 0.30%), and Welsh (9.3%, a difference of 0.38%).
| Demographics | Rating | Rank | Seniors Poverty Over the Age of 65 |
| Swiss | 99.9 /100 | #19 | Exceptional 9.2% |
| Thais | 99.9 /100 | #20 | Exceptional 9.2% |
| Luxembourgers | 99.9 /100 | #21 | Exceptional 9.2% |
| Slovenes | 99.9 /100 | #22 | Exceptional 9.3% |
| Welsh | 99.9 /100 | #23 | Exceptional 9.3% |
| Bulgarians | 99.9 /100 | #24 | Exceptional 9.3% |
| Irish | 99.9 /100 | #25 | Exceptional 9.3% |
| Immigrants | Scotland | 99.9 /100 | #26 | Exceptional 9.3% |
| Italians | 99.9 /100 | #27 | Exceptional 9.3% |
| Tongans | 99.9 /100 | #28 | Exceptional 9.3% |
| Bhutanese | 99.9 /100 | #29 | Exceptional 9.3% |
| Menominee | 99.8 /100 | #30 | Exceptional 9.4% |
| Finns | 99.8 /100 | #31 | Exceptional 9.4% |
| Northern Europeans | 99.8 /100 | #32 | Exceptional 9.4% |
| Native Hawaiians | 99.8 /100 | #33 | Exceptional 9.4% |
Demographics Similar to Immigrants from Canada by Seniors Poverty Over the Age of 65
In terms of seniors poverty over the age of 65, the demographic groups most similar to Immigrants from Canada are Celtic (9.8%, a difference of 0.030%), Iranian (9.8%, a difference of 0.11%), Serbian (9.8%, a difference of 0.15%), French Canadian (9.8%, a difference of 0.16%), and Bolivian (9.8%, a difference of 0.21%).
| Demographics | Rating | Rank | Seniors Poverty Over the Age of 65 |
| Filipinos | 99.3 /100 | #52 | Exceptional 9.7% |
| Slavs | 99.2 /100 | #53 | Exceptional 9.8% |
| Immigrants | Northern Europe | 99.2 /100 | #54 | Exceptional 9.8% |
| Afghans | 99.2 /100 | #55 | Exceptional 9.8% |
| Immigrants | England | 99.1 /100 | #56 | Exceptional 9.8% |
| Bolivians | 99.1 /100 | #57 | Exceptional 9.8% |
| Serbians | 99.1 /100 | #58 | Exceptional 9.8% |
| Immigrants | Canada | 99.0 /100 | #59 | Exceptional 9.8% |
| Celtics | 99.0 /100 | #60 | Exceptional 9.8% |
| Iranians | 98.9 /100 | #61 | Exceptional 9.8% |
| French Canadians | 98.9 /100 | #62 | Exceptional 9.8% |
| Macedonians | 98.8 /100 | #63 | Exceptional 9.9% |
| Immigrants | North America | 98.8 /100 | #64 | Exceptional 9.9% |
| Pennsylvania Germans | 98.7 /100 | #65 | Exceptional 9.9% |
| Immigrants | Netherlands | 98.7 /100 | #66 | Exceptional 9.9% |