Immigrants from Russia vs Seminole Receiving Food Stamps
COMPARE
Immigrants from Russia
Seminole
Receiving Food Stamps
Receiving Food Stamps Comparison
Immigrants from Russia
Seminole
10.8%
RECEIVING FOOD STAMPS
90.9/ 100
METRIC RATING
133rd/ 347
METRIC RANK
14.8%
RECEIVING FOOD STAMPS
0.1/ 100
METRIC RATING
277th/ 347
METRIC RANK
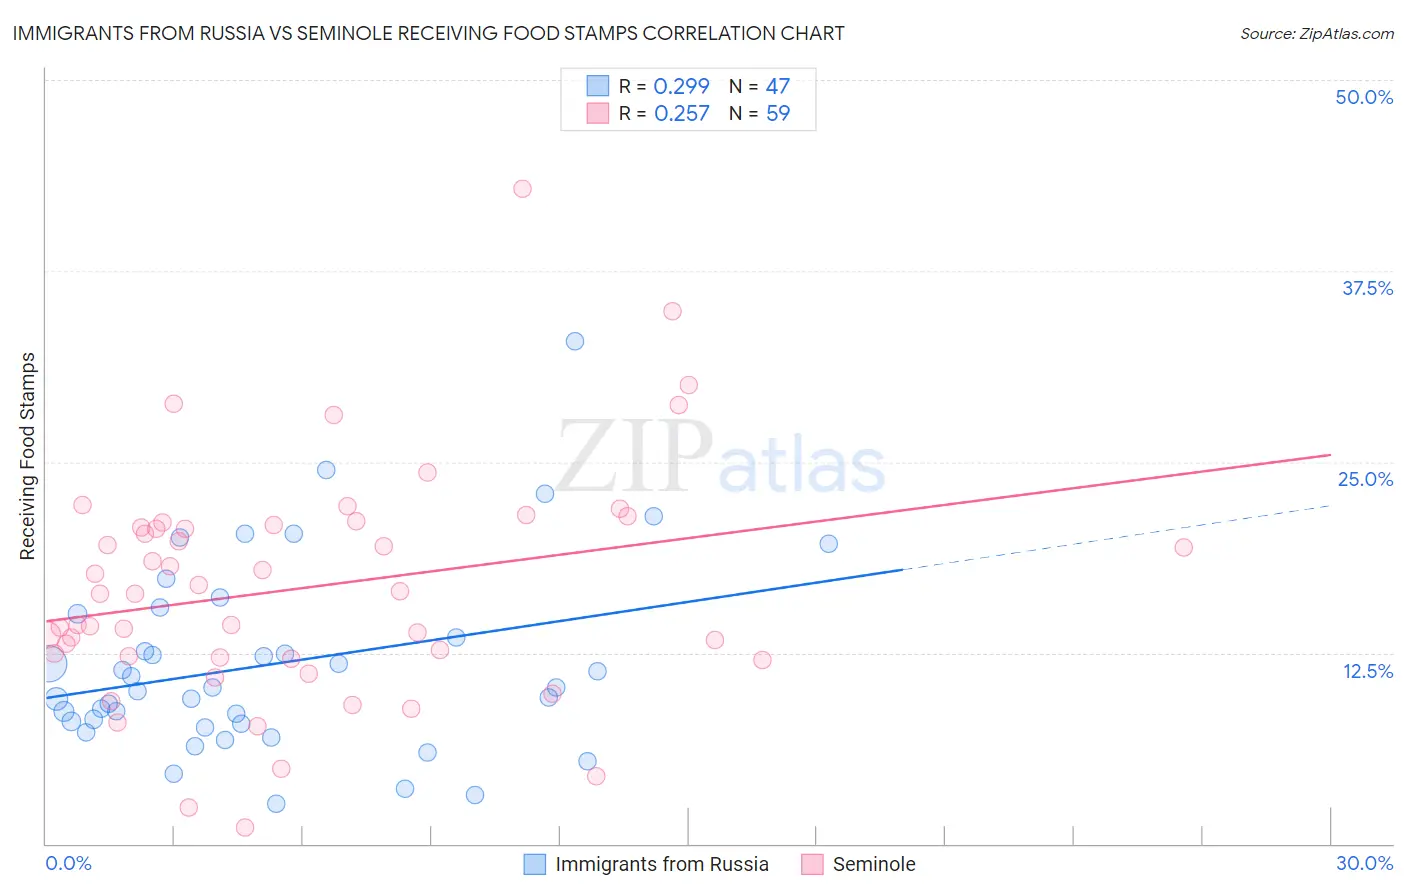
Immigrants from Russia vs Seminole Receiving Food Stamps Correlation Chart
The statistical analysis conducted on geographies consisting of 346,828,802 people shows a weak positive correlation between the proportion of Immigrants from Russia and percentage of population receiving government assistance and/or food stamps in the United States with a correlation coefficient (R) of 0.299 and weighted average of 10.8%. Similarly, the statistical analysis conducted on geographies consisting of 118,279,359 people shows a weak positive correlation between the proportion of Seminole and percentage of population receiving government assistance and/or food stamps in the United States with a correlation coefficient (R) of 0.257 and weighted average of 14.8%, a difference of 37.3%.
Receiving Food Stamps Correlation Summary
| Measurement | Immigrants from Russia | Seminole |
| Minimum | 2.6% | 1.1% |
| Maximum | 32.9% | 42.9% |
| Range | 30.3% | 41.8% |
| Mean | 11.8% | 16.8% |
| Median | 10.2% | 16.4% |
| Interquartile 25% (IQ1) | 7.8% | 12.2% |
| Interquartile 75% (IQ3) | 15.1% | 20.9% |
| Interquartile Range (IQR) | 7.2% | 8.7% |
| Standard Deviation (Sample) | 6.2% | 7.6% |
| Standard Deviation (Population) | 6.1% | 7.5% |
Similar Demographics by Receiving Food Stamps
Demographics Similar to Immigrants from Russia by Receiving Food Stamps
In terms of receiving food stamps, the demographic groups most similar to Immigrants from Russia are Immigrants from Brazil (10.8%, a difference of 0.30%), Argentinean (10.8%, a difference of 0.32%), Slovak (10.8%, a difference of 0.49%), Immigrants from Germany (10.7%, a difference of 0.50%), and Immigrants from Eastern Europe (10.8%, a difference of 0.51%).
| Demographics | Rating | Rank | Receiving Food Stamps |
| Afghans | 92.6 /100 | #126 | Exceptional 10.7% |
| Immigrants | Ethiopia | 92.6 /100 | #127 | Exceptional 10.7% |
| Immigrants | Jordan | 92.5 /100 | #128 | Exceptional 10.7% |
| Yugoslavians | 92.5 /100 | #129 | Exceptional 10.7% |
| Israelis | 92.4 /100 | #130 | Exceptional 10.7% |
| French | 92.3 /100 | #131 | Exceptional 10.7% |
| Immigrants | Germany | 92.0 /100 | #132 | Exceptional 10.7% |
| Immigrants | Russia | 90.9 /100 | #133 | Exceptional 10.8% |
| Immigrants | Brazil | 90.3 /100 | #134 | Exceptional 10.8% |
| Argentineans | 90.2 /100 | #135 | Exceptional 10.8% |
| Slovaks | 89.8 /100 | #136 | Excellent 10.8% |
| Immigrants | Eastern Europe | 89.8 /100 | #137 | Excellent 10.8% |
| Immigrants | Moldova | 88.5 /100 | #138 | Excellent 10.9% |
| Hmong | 88.4 /100 | #139 | Excellent 10.9% |
| Celtics | 87.8 /100 | #140 | Excellent 10.9% |
Demographics Similar to Seminole by Receiving Food Stamps
In terms of receiving food stamps, the demographic groups most similar to Seminole are Liberian (14.8%, a difference of 0.050%), Belizean (14.8%, a difference of 0.13%), Kiowa (14.9%, a difference of 0.40%), Ecuadorian (14.9%, a difference of 0.45%), and Ute (14.7%, a difference of 0.76%).
| Demographics | Rating | Rank | Receiving Food Stamps |
| Mexicans | 0.1 /100 | #270 | Tragic 14.6% |
| Immigrants | Guatemala | 0.1 /100 | #271 | Tragic 14.6% |
| Chippewa | 0.1 /100 | #272 | Tragic 14.7% |
| Alaskan Athabascans | 0.1 /100 | #273 | Tragic 14.7% |
| Immigrants | Western Africa | 0.1 /100 | #274 | Tragic 14.7% |
| Ute | 0.1 /100 | #275 | Tragic 14.7% |
| Liberians | 0.1 /100 | #276 | Tragic 14.8% |
| Seminole | 0.1 /100 | #277 | Tragic 14.8% |
| Belizeans | 0.1 /100 | #278 | Tragic 14.8% |
| Kiowa | 0.0 /100 | #279 | Tragic 14.9% |
| Ecuadorians | 0.0 /100 | #280 | Tragic 14.9% |
| Spanish American Indians | 0.0 /100 | #281 | Tragic 14.9% |
| Immigrants | Central America | 0.0 /100 | #282 | Tragic 15.0% |
| Bangladeshis | 0.0 /100 | #283 | Tragic 15.0% |
| Immigrants | Ecuador | 0.0 /100 | #284 | Tragic 15.0% |