Immigrants from Russia vs Peruvian Female Poverty

COMPARE

Immigrants from Russia
Race
Ancestry
AfghanAfricanAlaska NativeAlaskan AthabascanAlbanianAleutAlsatianAmericanApacheArabArapahoArgentineanArmenianAssyrian/Chaldean/SyriacAustralianAustrianBahamianBangladeshiBarbadianBasqueBelgianBelizeanBermudanBhutaneseBlackfeetBolivianBrazilianBritishBritish West IndianBulgarianBurmeseCajunCambodianCanadianCape VerdeanCarpatho RusynCelticCentral AmericanCentral American IndianCherokeeCheyenneChickasawChileanChineseChippewaChoctawColombianColvilleComancheCosta RicanCreeCreekCroatianCrowCubanCypriotCzechCzechoslovakianDanishDelawareDominicanDutchDutch West IndianEastern EuropeanEcuadorianEgyptianEnglishEstonianEthiopianEuropeanFijianFilipinoFinnishFrenchFrench American IndianFrench CanadianGermanGerman RussianGhanaianGreekGuamanian/ChamorroGuatemalanGuyaneseHaitianHmongHonduranHopiHoumaHungarianIcelanderIndian (Asian)IndonesianInupiatIranianIraqiIrishIroquoisIsraeliItalianJamaicanJapaneseJordanianKenyanKiowaKoreanLaotianLatvianLebaneseLiberianLithuanianLumbeeLuxembourgerMacedonianMalaysianMalteseMarshalleseMenomineeMexicanMexican American IndianMongolianMoroccanNative HawaiianNavajoNepaleseNew ZealanderNicaraguanNigerianNorthern EuropeanNorwegianOkinawanOsageOttawaPaiutePakistaniPalestinianPanamanianParaguayanPennsylvania GermanPimaPolishPortuguesePotawatomiPuebloPuerto RicanPuget Sound SalishRomanianRussianSalvadoranSamoanScandinavianScotch-IrishScottishSeminoleSenegaleseSerbianShoshoneSierra LeoneanSiouxSlavicSlovakSloveneSomaliSouth AfricanSouth AmericanSouth American IndianSoviet UnionSpaniardSpanishSpanish AmericanSpanish American IndianSri LankanSubsaharan AfricanSudaneseSwedishSwissSyrianTaiwaneseThaiTlingit-HaidaTohono O'OdhamTonganTrinidadian and TobagonianTsimshianTurkishU.S. Virgin IslanderUgandanUkrainianUruguayanUteVenezuelanVietnameseWelshWest IndianYakamaYaquiYugoslavianYumanYup'ikZimbabwean
Immigration
NonimmigrantsImmigrantsAfghanistanAfricaAlbaniaArgentinaArmeniaAsiaAustraliaAustriaBahamasBangladeshBarbadosBelarusBelgiumBelizeBoliviaBosnia and HerzegovinaBrazilBulgariaBurma/MyanmarCabo VerdeCambodiaCameroonCanadaCaribbeanCentral AmericaChileChinaColombiaCongoCosta RicaCroatiaCubaCzechoslovakiaDenmarkDominicaDominican RepublicEastern AfricaEastern AsiaEastern EuropeEcuadorEgyptEl SalvadorEnglandEritreaEthiopiaEuropeFijiFranceGermanyGhanaGreeceGrenadaGuatemalaGuyanaHaitiHondurasHong KongHungaryIndiaIndonesiaIranIraqIrelandIsraelItalyJamaicaJapanJordanKazakhstanKenyaKoreaKuwaitLaosLatin AmericaLatviaLebanonLiberiaLithuaniaMalaysiaMexicoMicronesiaMiddle AfricaMoldovaMoroccoNepalNetherlandsNicaraguaNigeriaNorth AmericaNorth MacedoniaNorthern AfricaNorthern EuropeNorwayOceaniaPakistanPanamaPeruPhilippinesPolandPortugalRomaniaRussiaSaudi ArabiaScotlandSenegalSerbiaSierra LeoneSingaporeSomaliaSouth AfricaSouth AmericaSouth Central AsiaSouth Eastern AsiaSouthern EuropeSpainSri LankaSt. Vincent and the GrenadinesSudanSwedenSwitzerlandSyriaTaiwanThailandTrinidad and TobagoTurkeyUgandaUkraineUruguayUzbekistanVenezuelaVietnamWest IndiesWestern AfricaWestern AsiaWestern EuropeYemenZaireZimbabweAzores
Peruvian
Race
Ancestry
AfghanAfricanAlaska NativeAlaskan AthabascanAlbanianAleutAlsatianAmericanApacheArabArapahoArgentineanArmenianAssyrian/Chaldean/SyriacAustralianAustrianBahamianBangladeshiBarbadianBasqueBelgianBelizeanBermudanBhutaneseBlackfeetBolivianBrazilianBritishBritish West IndianBulgarianBurmeseCajunCambodianCanadianCape VerdeanCarpatho RusynCelticCentral AmericanCentral American IndianCherokeeCheyenneChickasawChileanChineseChippewaChoctawColombianColvilleComancheCosta RicanCreeCreekCroatianCrowCubanCypriotCzechCzechoslovakianDanishDelawareDominicanDutchDutch West IndianEastern EuropeanEcuadorianEgyptianEnglishEstonianEthiopianEuropeanFijianFilipinoFinnishFrenchFrench American IndianFrench CanadianGermanGerman RussianGhanaianGreekGuamanian/ChamorroGuatemalanGuyaneseHaitianHmongHonduranHopiHoumaHungarianIcelanderIndian (Asian)IndonesianInupiatIranianIraqiIrishIroquoisIsraeliItalianJamaicanJapaneseJordanianKenyanKiowaKoreanLaotianLatvianLebaneseLiberianLithuanianLumbeeLuxembourgerMacedonianMalaysianMalteseMarshalleseMenomineeMexicanMexican American IndianMongolianMoroccanNative HawaiianNavajoNepaleseNew ZealanderNicaraguanNigerianNorthern EuropeanNorwegianOkinawanOsageOttawaPaiutePakistaniPalestinianPanamanianParaguayanPennsylvania GermanPeruvianPimaPolishPortuguesePotawatomiPuebloPuerto RicanPuget Sound SalishRomanianRussianSalvadoranSamoanScandinavianScotch-IrishScottishSeminoleSenegaleseSerbianShoshoneSierra LeoneanSiouxSlavicSlovakSloveneSomaliSouth AfricanSouth AmericanSouth American IndianSoviet UnionSpaniardSpanishSpanish AmericanSpanish American IndianSri LankanSubsaharan AfricanSudaneseSwedishSwissSyrianTaiwaneseThaiTlingit-HaidaTohono O'OdhamTonganTrinidadian and TobagonianTsimshianTurkishU.S. Virgin IslanderUgandanUkrainianUruguayanUteVenezuelanVietnameseWelshWest IndianYakamaYaquiYugoslavianYumanYup'ikZimbabwean
Immigration
NonimmigrantsImmigrantsAfghanistanAfricaAlbaniaArgentinaArmeniaAsiaAustraliaAustriaBahamasBangladeshBarbadosBelarusBelgiumBelizeBoliviaBosnia and HerzegovinaBrazilBulgariaBurma/MyanmarCabo VerdeCambodiaCameroonCanadaCaribbeanCentral AmericaChileChinaColombiaCongoCosta RicaCroatiaCubaCzechoslovakiaDenmarkDominicaDominican RepublicEastern AfricaEastern AsiaEastern EuropeEcuadorEgyptEl SalvadorEnglandEritreaEthiopiaEuropeFijiFranceGermanyGhanaGreeceGrenadaGuatemalaGuyanaHaitiHondurasHong KongHungaryIndiaIndonesiaIranIraqIrelandIsraelItalyJamaicaJapanJordanKazakhstanKenyaKoreaKuwaitLaosLatin AmericaLatviaLebanonLiberiaLithuaniaMalaysiaMexicoMicronesiaMiddle AfricaMoldovaMoroccoNepalNetherlandsNicaraguaNigeriaNorth AmericaNorth MacedoniaNorthern AfricaNorthern EuropeNorwayOceaniaPakistanPanamaPeruPhilippinesPolandPortugalRomaniaSaudi ArabiaScotlandSenegalSerbiaSierra LeoneSingaporeSomaliaSouth AfricaSouth AmericaSouth Central AsiaSouth Eastern AsiaSouthern EuropeSpainSri LankaSt. Vincent and the GrenadinesSudanSwedenSwitzerlandSyriaTaiwanThailandTrinidad and TobagoTurkeyUgandaUkraineUruguayUzbekistanVenezuelaVietnamWest IndiesWestern AfricaWestern AsiaWestern EuropeYemenZaireZimbabweAzores
Female Poverty
Income
Poverty
Unemployment
Labor Participation
Family Structure
Vehicle Availability
Education Level
Disability

Female Poverty Comparison

Immigrants from Russia

Peruvians

Exceptional
Excellent
12.7%
FEMALE POVERTY
91.2/ 100
METRIC RATING
116th/ 347
METRIC RANK
12.9%
FEMALE POVERTY
85.2/ 100
METRIC RATING
136th/ 347
METRIC RANK

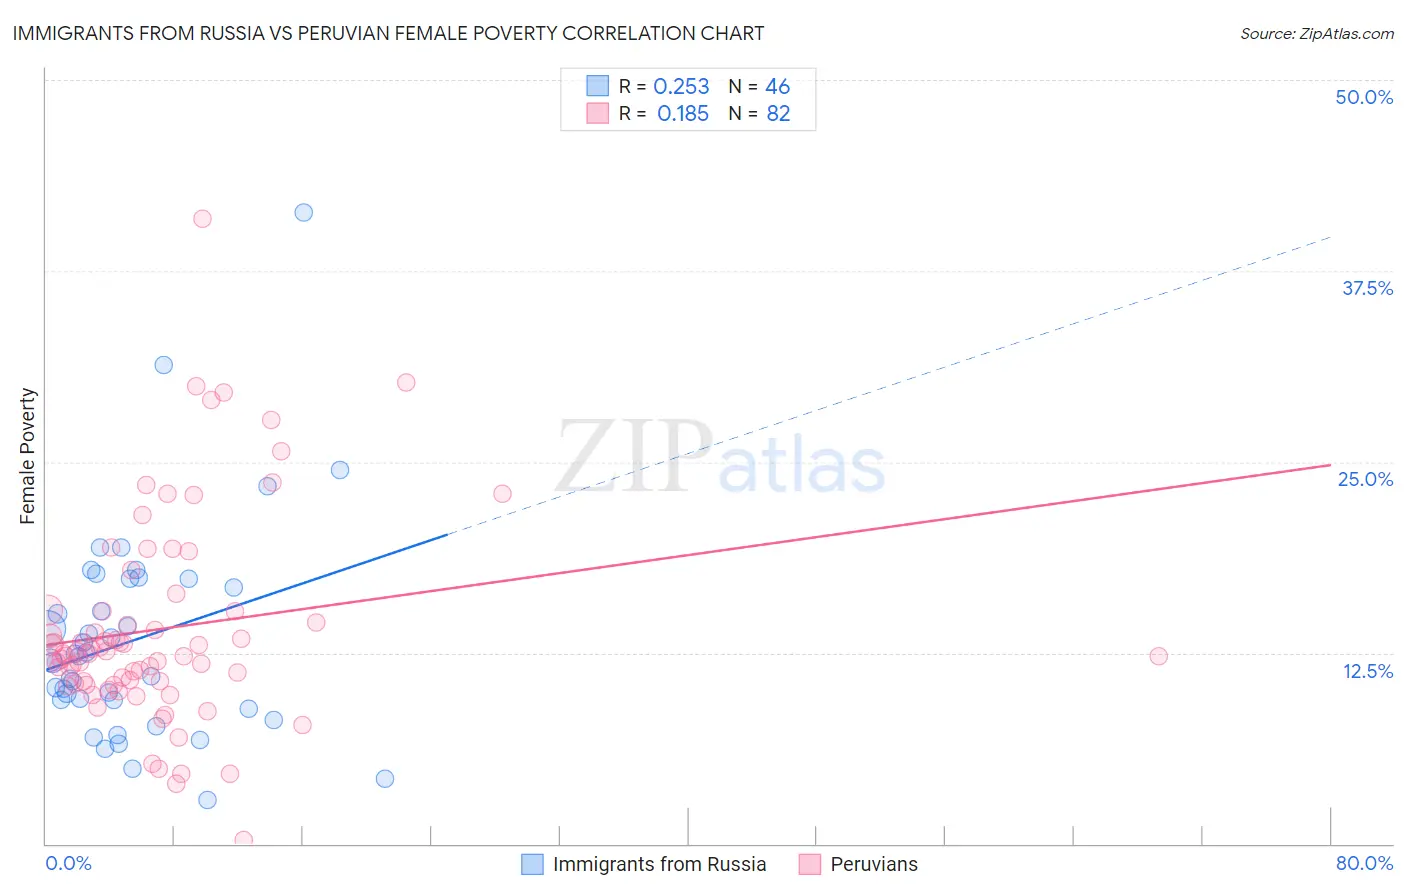
Immigrants from Russia vs Peruvian Female Poverty Correlation Chart

The statistical analysis conducted on geographies consisting of 347,656,747 people shows a weak positive correlation between the proportion of Immigrants from Russia and poverty level among females in the United States with a correlation coefficient (R) of 0.253 and weighted average of 12.7%. Similarly, the statistical analysis conducted on geographies consisting of 362,941,638 people shows a poor positive correlation between the proportion of Peruvians and poverty level among females in the United States with a correlation coefficient (R) of 0.185 and weighted average of 12.9%, a difference of 1.5%.
Immigrants from Russia vs Peruvian Female Poverty

Female Poverty Correlation Summary

MeasurementImmigrants from RussiaPeruvian
Minimum2.9%0.21%
Maximum41.3%40.9%
Range38.4%40.7%
Mean13.3%14.1%
Median12.1%12.5%
Interquartile 25% (IQ1)9.4%10.5%
Interquartile 75% (IQ3)17.4%15.2%
Interquartile Range (IQR)8.0%4.8%
Standard Deviation (Sample)7.0%6.8%
Standard Deviation (Population)6.9%6.8%

Demographics Similar to Immigrants from Russia and Peruvians by Female Poverty

In terms of female poverty, the demographic groups most similar to Immigrants from Russia are Immigrants from Southern Europe (12.7%, a difference of 0.070%), Sri Lankan (12.7%, a difference of 0.090%), Albanian (12.7%, a difference of 0.10%), New Zealander (12.7%, a difference of 0.16%), and Immigrants from Hungary (12.7%, a difference of 0.26%). Similarly, the demographic groups most similar to Peruvians are French (12.9%, a difference of 0.080%), Immigrants from Switzerland (12.9%, a difference of 0.13%), Immigrants from Western Europe (12.8%, a difference of 0.30%), Immigrants from Jordan (12.8%, a difference of 0.36%), and Immigrants from Argentina (12.8%, a difference of 0.37%).
DemographicsRating | RankFemale Poverty
Immigrants | Russia
91.2
/100
|
#116
Exceptional
12.7%
Immigrants | Southern Europe
90.9
/100
|
#117
Exceptional
12.7%
Sri Lankans
90.9
/100
|
#118
Exceptional
12.7%
Albanians
90.8
/100
|
#119
Exceptional
12.7%
New Zealanders
90.6
/100
|
#120
Exceptional
12.7%
Immigrants | Hungary
90.3
/100
|
#121
Exceptional
12.7%
French Canadians
90.2
/100
|
#122
Exceptional
12.7%
Immigrants | South Eastern Asia
89.9
/100
|
#123
Excellent
12.7%
Immigrants | Norway
89.3
/100
|
#124
Excellent
12.8%
Argentineans
89.1
/100
|
#125
Excellent
12.8%
Immigrants | Ukraine
88.8
/100
|
#126
Excellent
12.8%
South Africans
88.4
/100
|
#127
Excellent
12.8%
Immigrants | Belarus
88.2
/100
|
#128
Excellent
12.8%
Immigrants | Brazil
87.9
/100
|
#129
Excellent
12.8%
Immigrants | Vietnam
87.1
/100
|
#130
Excellent
12.8%
Immigrants | Argentina
87.0
/100
|
#131
Excellent
12.8%
Immigrants | Jordan
86.9
/100
|
#132
Excellent
12.8%
Immigrants | Western Europe
86.6
/100
|
#133
Excellent
12.8%
Immigrants | Switzerland
85.8
/100
|
#134
Excellent
12.9%
French
85.6
/100
|
#135
Excellent
12.9%
Peruvians
85.2
/100
|
#136
Excellent
12.9%