Immigrants from Romania vs Immigrants from Colombia Child Poverty Under the Age of 5

COMPARE

Immigrants from Romania
Race
Ancestry
AfghanAfricanAlaska NativeAlaskan AthabascanAlbanianAleutAlsatianAmericanApacheArabArapahoArgentineanArmenianAssyrian/Chaldean/SyriacAustralianAustrianBahamianBangladeshiBarbadianBasqueBelgianBelizeanBermudanBhutaneseBlackfeetBolivianBrazilianBritishBritish West IndianBulgarianBurmeseCajunCambodianCanadianCape VerdeanCarpatho RusynCelticCentral AmericanCentral American IndianCherokeeCheyenneChickasawChileanChineseChippewaChoctawColombianColvilleComancheCosta RicanCreeCreekCroatianCrowCubanCypriotCzechCzechoslovakianDanishDelawareDominicanDutchDutch West IndianEastern EuropeanEcuadorianEgyptianEnglishEstonianEthiopianEuropeanFijianFilipinoFinnishFrenchFrench American IndianFrench CanadianGermanGerman RussianGhanaianGreekGuamanian/ChamorroGuatemalanGuyaneseHaitianHmongHonduranHopiHoumaHungarianIcelanderIndian (Asian)IndonesianInupiatIranianIraqiIrishIroquoisIsraeliItalianJamaicanJapaneseJordanianKenyanKiowaKoreanLaotianLatvianLebaneseLiberianLithuanianLumbeeLuxembourgerMacedonianMalaysianMalteseMarshalleseMenomineeMexicanMexican American IndianMongolianMoroccanNative HawaiianNavajoNepaleseNew ZealanderNicaraguanNigerianNorthern EuropeanNorwegianOkinawanOsageOttawaPaiutePakistaniPalestinianPanamanianParaguayanPennsylvania GermanPeruvianPimaPolishPortuguesePotawatomiPuebloPuerto RicanPuget Sound SalishRomanianRussianSalvadoranSamoanScandinavianScotch-IrishScottishSeminoleSenegaleseSerbianShoshoneSierra LeoneanSiouxSlavicSlovakSloveneSomaliSouth AfricanSouth AmericanSouth American IndianSoviet UnionSpaniardSpanishSpanish AmericanSpanish American IndianSri LankanSubsaharan AfricanSudaneseSwedishSwissSyrianTaiwaneseThaiTlingit-HaidaTohono O'OdhamTonganTrinidadian and TobagonianTsimshianTurkishU.S. Virgin IslanderUgandanUkrainianUruguayanUteVenezuelanVietnameseWelshWest IndianYakamaYaquiYugoslavianYumanYup'ikZimbabwean
Immigration
NonimmigrantsImmigrantsAfghanistanAfricaAlbaniaArgentinaArmeniaAsiaAustraliaAustriaBahamasBangladeshBarbadosBelarusBelgiumBelizeBoliviaBosnia and HerzegovinaBrazilBulgariaBurma/MyanmarCabo VerdeCambodiaCameroonCanadaCaribbeanCentral AmericaChileChinaCongoCosta RicaCroatiaCubaCzechoslovakiaDenmarkDominicaDominican RepublicEastern AfricaEastern AsiaEastern EuropeEcuadorEgyptEl SalvadorEnglandEritreaEthiopiaEuropeFijiFranceGermanyGhanaGreeceGrenadaGuatemalaGuyanaHaitiHondurasHong KongHungaryIndiaIndonesiaIranIraqIrelandIsraelItalyJamaicaJapanJordanKazakhstanKenyaKoreaKuwaitLaosLatin AmericaLatviaLebanonLiberiaLithuaniaMalaysiaMexicoMicronesiaMiddle AfricaMoldovaMoroccoNepalNetherlandsNicaraguaNigeriaNorth AmericaNorth MacedoniaNorthern AfricaNorthern EuropeNorwayOceaniaPakistanPanamaPeruPhilippinesPolandPortugalRomaniaRussiaSaudi ArabiaScotlandSenegalSerbiaSierra LeoneSingaporeSomaliaSouth AfricaSouth AmericaSouth Central AsiaSouth Eastern AsiaSouthern EuropeSpainSri LankaSt. Vincent and the GrenadinesSudanSwedenSwitzerlandSyriaTaiwanThailandTrinidad and TobagoTurkeyUgandaUkraineUruguayUzbekistanVenezuelaVietnamWest IndiesWestern AfricaWestern AsiaWestern EuropeYemenZaireZimbabweAzores
Immigrants from Colombia
Race
Ancestry
AfghanAfricanAlaska NativeAlaskan AthabascanAlbanianAleutAlsatianAmericanApacheArabArapahoArgentineanArmenianAssyrian/Chaldean/SyriacAustralianAustrianBahamianBangladeshiBarbadianBasqueBelgianBelizeanBermudanBhutaneseBlackfeetBolivianBrazilianBritishBritish West IndianBulgarianBurmeseCajunCambodianCanadianCape VerdeanCarpatho RusynCelticCentral AmericanCentral American IndianCherokeeCheyenneChickasawChileanChineseChippewaChoctawColombianColvilleComancheCosta RicanCreeCreekCroatianCrowCubanCypriotCzechCzechoslovakianDanishDelawareDominicanDutchDutch West IndianEastern EuropeanEcuadorianEgyptianEnglishEstonianEthiopianEuropeanFijianFilipinoFinnishFrenchFrench American IndianFrench CanadianGermanGerman RussianGhanaianGreekGuamanian/ChamorroGuatemalanGuyaneseHaitianHmongHonduranHopiHoumaHungarianIcelanderIndian (Asian)IndonesianInupiatIranianIraqiIrishIroquoisIsraeliItalianJamaicanJapaneseJordanianKenyanKiowaKoreanLaotianLatvianLebaneseLiberianLithuanianLumbeeLuxembourgerMacedonianMalaysianMalteseMarshalleseMenomineeMexicanMexican American IndianMongolianMoroccanNative HawaiianNavajoNepaleseNew ZealanderNicaraguanNigerianNorthern EuropeanNorwegianOkinawanOsageOttawaPaiutePakistaniPalestinianPanamanianParaguayanPennsylvania GermanPeruvianPimaPolishPortuguesePotawatomiPuebloPuerto RicanPuget Sound SalishRomanianRussianSalvadoranSamoanScandinavianScotch-IrishScottishSeminoleSenegaleseSerbianShoshoneSierra LeoneanSiouxSlavicSlovakSloveneSomaliSouth AfricanSouth AmericanSouth American IndianSoviet UnionSpaniardSpanishSpanish AmericanSpanish American IndianSri LankanSubsaharan AfricanSudaneseSwedishSwissSyrianTaiwaneseThaiTlingit-HaidaTohono O'OdhamTonganTrinidadian and TobagonianTsimshianTurkishU.S. Virgin IslanderUgandanUkrainianUruguayanUteVenezuelanVietnameseWelshWest IndianYakamaYaquiYugoslavianYumanYup'ikZimbabwean
Immigration
NonimmigrantsImmigrantsAfghanistanAfricaAlbaniaArgentinaArmeniaAsiaAustraliaAustriaBahamasBangladeshBarbadosBelarusBelgiumBelizeBoliviaBosnia and HerzegovinaBrazilBulgariaBurma/MyanmarCabo VerdeCambodiaCameroonCanadaCaribbeanCentral AmericaChileChinaColombiaCongoCosta RicaCroatiaCubaCzechoslovakiaDenmarkDominicaDominican RepublicEastern AfricaEastern AsiaEastern EuropeEcuadorEgyptEl SalvadorEnglandEritreaEthiopiaEuropeFijiFranceGermanyGhanaGreeceGrenadaGuatemalaGuyanaHaitiHondurasHong KongHungaryIndiaIndonesiaIranIraqIrelandIsraelItalyJamaicaJapanJordanKazakhstanKenyaKoreaKuwaitLaosLatin AmericaLatviaLebanonLiberiaLithuaniaMalaysiaMexicoMicronesiaMiddle AfricaMoldovaMoroccoNepalNetherlandsNicaraguaNigeriaNorth AmericaNorth MacedoniaNorthern AfricaNorthern EuropeNorwayOceaniaPakistanPanamaPeruPhilippinesPolandPortugalRussiaSaudi ArabiaScotlandSenegalSerbiaSierra LeoneSingaporeSomaliaSouth AfricaSouth AmericaSouth Central AsiaSouth Eastern AsiaSouthern EuropeSpainSri LankaSt. Vincent and the GrenadinesSudanSwedenSwitzerlandSyriaTaiwanThailandTrinidad and TobagoTurkeyUgandaUkraineUruguayUzbekistanVenezuelaVietnamWest IndiesWestern AfricaWestern AsiaWestern EuropeYemenZaireZimbabweAzores
Child Poverty Under the Age of 5
Income
Poverty
Unemployment
Labor Participation
Family Structure
Vehicle Availability
Education Level
Disability

Child Poverty Under the Age of 5 Comparison

Immigrants from Romania

Immigrants from Colombia

Exceptional
Good
15.2%
CHILD POVERTY UNDER THE AGE OF 5
99.1/ 100
METRIC RATING
64th/ 347
METRIC RANK
16.9%
CHILD POVERTY UNDER THE AGE OF 5
66.9/ 100
METRIC RATING
165th/ 347
METRIC RANK

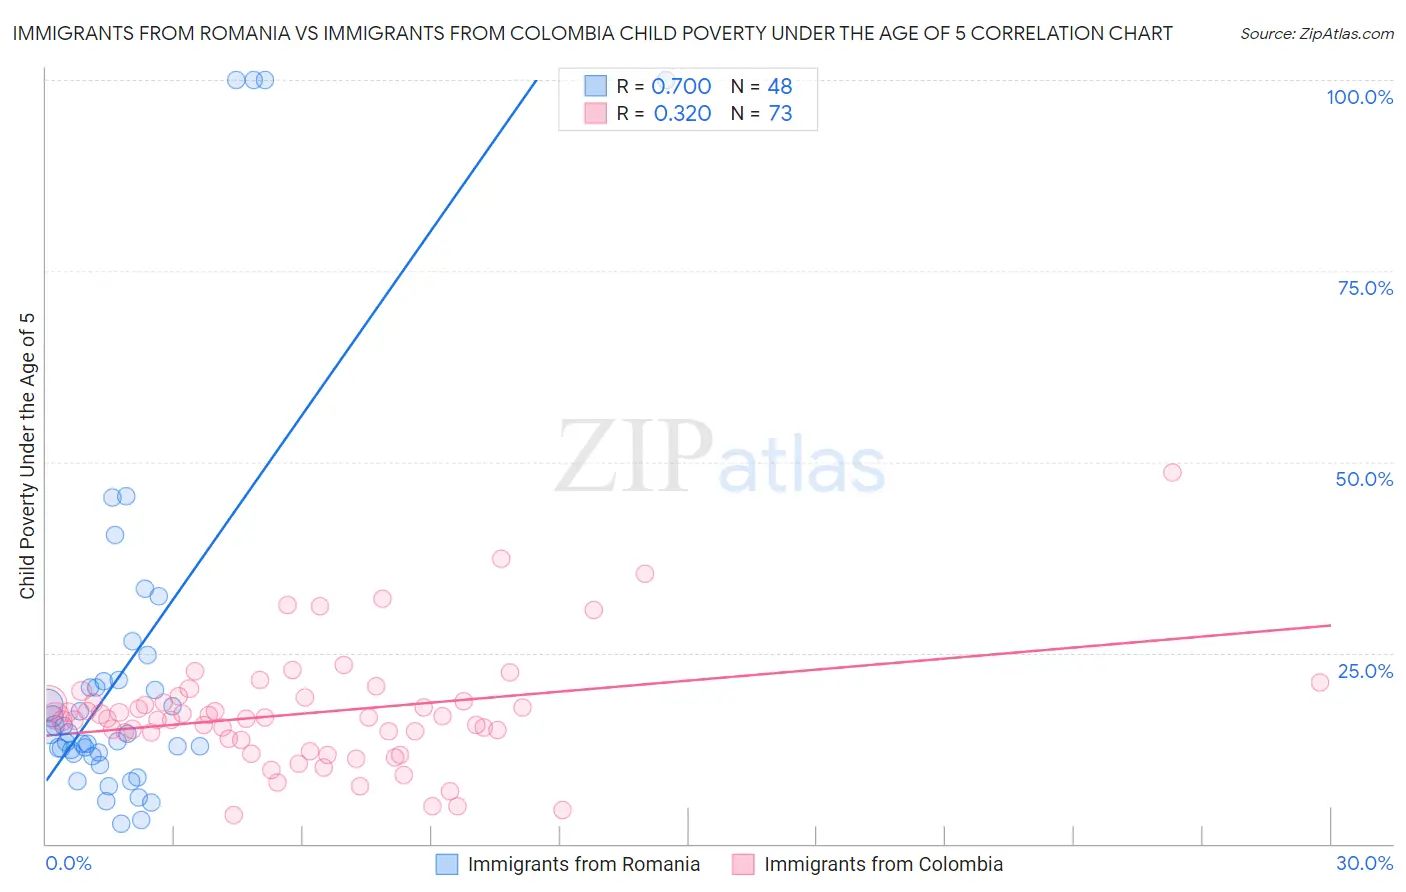
Immigrants from Romania vs Immigrants from Colombia Child Poverty Under the Age of 5 Correlation Chart

The statistical analysis conducted on geographies consisting of 248,042,461 people shows a strong positive correlation between the proportion of Immigrants from Romania and poverty level among children under the age of 5 in the United States with a correlation coefficient (R) of 0.700 and weighted average of 15.2%. Similarly, the statistical analysis conducted on geographies consisting of 364,956,826 people shows a mild positive correlation between the proportion of Immigrants from Colombia and poverty level among children under the age of 5 in the United States with a correlation coefficient (R) of 0.320 and weighted average of 16.9%, a difference of 11.7%.
Immigrants from Romania vs Immigrants from Colombia Child Poverty Under the Age of 5

Child Poverty Under the Age of 5 Correlation Summary

MeasurementImmigrants from RomaniaImmigrants from Colombia
Minimum2.6%3.7%
Maximum100.0%48.6%
Range97.4%44.9%
Mean23.5%17.1%
Median14.4%16.6%
Interquartile 25% (IQ1)11.9%13.7%
Interquartile 75% (IQ3)21.4%19.0%
Interquartile Range (IQR)9.5%5.3%
Standard Deviation (Sample)25.2%7.6%
Standard Deviation (Population)24.9%7.5%

Similar Demographics by Child Poverty Under the Age of 5

Demographics Similar to Immigrants from Romania by Child Poverty Under the Age of 5

In terms of child poverty under the age of 5, the demographic groups most similar to Immigrants from Romania are Immigrants from Europe (15.1%, a difference of 0.020%), Immigrants from Fiji (15.2%, a difference of 0.030%), Immigrants from Scotland (15.2%, a difference of 0.14%), Immigrants from Eastern Europe (15.1%, a difference of 0.15%), and Greek (15.2%, a difference of 0.21%).
DemographicsRating | RankChild Poverty Under the Age of 5
Egyptians
99.4
/100
|
#57
Exceptional
14.9%
Swedes
99.4
/100
|
#58
Exceptional
15.0%
Paraguayans
99.4
/100
|
#59
Exceptional
15.0%
Immigrants | Russia
99.3
/100
|
#60
Exceptional
15.0%
Immigrants | Poland
99.1
/100
|
#61
Exceptional
15.1%
Immigrants | Eastern Europe
99.1
/100
|
#62
Exceptional
15.1%
Immigrants | Europe
99.1
/100
|
#63
Exceptional
15.1%
Immigrants | Romania
99.1
/100
|
#64
Exceptional
15.2%
Immigrants | Fiji
99.0
/100
|
#65
Exceptional
15.2%
Immigrants | Scotland
99.0
/100
|
#66
Exceptional
15.2%
Greeks
99.0
/100
|
#67
Exceptional
15.2%
Zimbabweans
99.0
/100
|
#68
Exceptional
15.2%
Lithuanians
99.0
/100
|
#69
Exceptional
15.2%
Immigrants | Belgium
98.8
/100
|
#70
Exceptional
15.3%
Immigrants | Egypt
98.8
/100
|
#71
Exceptional
15.3%

Demographics Similar to Immigrants from Colombia by Child Poverty Under the Age of 5

In terms of child poverty under the age of 5, the demographic groups most similar to Immigrants from Colombia are Immigrants from Oceania (16.9%, a difference of 0.090%), Scottish (16.9%, a difference of 0.21%), Slavic (17.0%, a difference of 0.34%), Costa Rican (16.9%, a difference of 0.36%), and English (16.8%, a difference of 0.43%).
DemographicsRating | RankChild Poverty Under the Age of 5
Czechoslovakians
72.5
/100
|
#158
Good
16.8%
Immigrants | Syria
72.3
/100
|
#159
Good
16.8%
Irish
72.0
/100
|
#160
Good
16.8%
English
70.4
/100
|
#161
Good
16.8%
Costa Ricans
69.8
/100
|
#162
Good
16.9%
Scottish
68.6
/100
|
#163
Good
16.9%
Immigrants | Oceania
67.6
/100
|
#164
Good
16.9%
Immigrants | Colombia
66.9
/100
|
#165
Good
16.9%
Slavs
64.0
/100
|
#166
Good
17.0%
Immigrants | Uzbekistan
62.0
/100
|
#167
Good
17.0%
Uruguayans
60.5
/100
|
#168
Good
17.0%
Immigrants | South America
60.0
/100
|
#169
Good
17.1%
Immigrants | Western Asia
59.2
/100
|
#170
Average
17.1%
Immigrants | Morocco
58.9
/100
|
#171
Average
17.1%
Yugoslavians
54.1
/100
|
#172
Average
17.2%