Immigrants from Romania vs Aleut Child Poverty Under the Age of 16

COMPARE

Immigrants from Romania
Race
Ancestry
AfghanAfricanAlaska NativeAlaskan AthabascanAlbanianAlsatianAmericanApacheArabArapahoArgentineanArmenianAssyrian/Chaldean/SyriacAustralianAustrianBahamianBangladeshiBarbadianBasqueBelgianBelizeanBermudanBhutaneseBlackfeetBolivianBrazilianBritishBritish West IndianBulgarianBurmeseCajunCambodianCanadianCape VerdeanCarpatho RusynCelticCentral AmericanCentral American IndianCherokeeCheyenneChickasawChileanChineseChippewaChoctawColombianColvilleComancheCosta RicanCreeCreekCroatianCrowCubanCypriotCzechCzechoslovakianDanishDelawareDominicanDutchDutch West IndianEastern EuropeanEcuadorianEgyptianEnglishEstonianEthiopianEuropeanFijianFilipinoFinnishFrenchFrench American IndianFrench CanadianGermanGerman RussianGhanaianGreekGuamanian/ChamorroGuatemalanGuyaneseHaitianHmongHonduranHopiHoumaHungarianIcelanderIndian (Asian)IndonesianInupiatIranianIraqiIrishIroquoisIsraeliItalianJamaicanJapaneseJordanianKenyanKiowaKoreanLaotianLatvianLebaneseLiberianLithuanianLumbeeLuxembourgerMacedonianMalaysianMalteseMarshalleseMenomineeMexicanMexican American IndianMongolianMoroccanNative HawaiianNavajoNepaleseNew ZealanderNicaraguanNigerianNorthern EuropeanNorwegianOkinawanOsageOttawaPaiutePakistaniPalestinianPanamanianParaguayanPennsylvania GermanPeruvianPimaPolishPortuguesePotawatomiPuebloPuerto RicanPuget Sound SalishRomanianRussianSalvadoranSamoanScandinavianScotch-IrishScottishSeminoleSenegaleseSerbianShoshoneSierra LeoneanSiouxSlavicSlovakSloveneSomaliSouth AfricanSouth AmericanSouth American IndianSoviet UnionSpaniardSpanishSpanish AmericanSpanish American IndianSri LankanSubsaharan AfricanSudaneseSwedishSwissSyrianTaiwaneseThaiTlingit-HaidaTohono O'OdhamTonganTrinidadian and TobagonianTsimshianTurkishU.S. Virgin IslanderUgandanUkrainianUruguayanUteVenezuelanVietnameseWelshWest IndianYakamaYaquiYugoslavianYumanYup'ikZimbabwean
Immigration
NonimmigrantsImmigrantsAfghanistanAfricaAlbaniaArgentinaArmeniaAsiaAustraliaAustriaBahamasBangladeshBarbadosBelarusBelgiumBelizeBoliviaBosnia and HerzegovinaBrazilBulgariaBurma/MyanmarCabo VerdeCambodiaCameroonCanadaCaribbeanCentral AmericaChileChinaColombiaCongoCosta RicaCroatiaCubaCzechoslovakiaDenmarkDominicaDominican RepublicEastern AfricaEastern AsiaEastern EuropeEcuadorEgyptEl SalvadorEnglandEritreaEthiopiaEuropeFijiFranceGermanyGhanaGreeceGrenadaGuatemalaGuyanaHaitiHondurasHong KongHungaryIndiaIndonesiaIranIraqIrelandIsraelItalyJamaicaJapanJordanKazakhstanKenyaKoreaKuwaitLaosLatin AmericaLatviaLebanonLiberiaLithuaniaMalaysiaMexicoMicronesiaMiddle AfricaMoldovaMoroccoNepalNetherlandsNicaraguaNigeriaNorth AmericaNorth MacedoniaNorthern AfricaNorthern EuropeNorwayOceaniaPakistanPanamaPeruPhilippinesPolandPortugalRomaniaRussiaSaudi ArabiaScotlandSenegalSerbiaSierra LeoneSingaporeSomaliaSouth AfricaSouth AmericaSouth Central AsiaSouth Eastern AsiaSouthern EuropeSpainSri LankaSt. Vincent and the GrenadinesSudanSwedenSwitzerlandSyriaTaiwanThailandTrinidad and TobagoTurkeyUgandaUkraineUruguayUzbekistanVenezuelaVietnamWest IndiesWestern AfricaWestern AsiaWestern EuropeYemenZaireZimbabweAzores
Aleut
Race
Ancestry
AfghanAfricanAlaska NativeAlaskan AthabascanAlbanianAleutAlsatianAmericanApacheArabArapahoArgentineanArmenianAssyrian/Chaldean/SyriacAustralianAustrianBahamianBangladeshiBarbadianBasqueBelgianBelizeanBermudanBhutaneseBlackfeetBolivianBrazilianBritishBritish West IndianBulgarianBurmeseCajunCambodianCanadianCape VerdeanCarpatho RusynCelticCentral AmericanCentral American IndianCherokeeCheyenneChickasawChileanChineseChippewaChoctawColombianColvilleComancheCosta RicanCreeCreekCroatianCrowCubanCypriotCzechCzechoslovakianDanishDelawareDominicanDutchDutch West IndianEastern EuropeanEcuadorianEgyptianEnglishEstonianEthiopianEuropeanFijianFilipinoFinnishFrenchFrench American IndianFrench CanadianGermanGerman RussianGhanaianGreekGuamanian/ChamorroGuatemalanGuyaneseHaitianHmongHonduranHopiHoumaHungarianIcelanderIndian (Asian)IndonesianInupiatIranianIraqiIrishIroquoisIsraeliItalianJamaicanJapaneseJordanianKenyanKiowaKoreanLaotianLatvianLebaneseLiberianLithuanianLumbeeLuxembourgerMacedonianMalaysianMalteseMarshalleseMenomineeMexicanMexican American IndianMongolianMoroccanNative HawaiianNavajoNepaleseNew ZealanderNicaraguanNigerianNorthern EuropeanNorwegianOkinawanOsageOttawaPaiutePakistaniPalestinianPanamanianParaguayanPennsylvania GermanPeruvianPimaPolishPortuguesePotawatomiPuebloPuerto RicanPuget Sound SalishRomanianRussianSalvadoranSamoanScandinavianScotch-IrishScottishSeminoleSenegaleseSerbianShoshoneSierra LeoneanSiouxSlavicSlovakSloveneSomaliSouth AfricanSouth AmericanSouth American IndianSoviet UnionSpaniardSpanishSpanish AmericanSpanish American IndianSri LankanSubsaharan AfricanSudaneseSwedishSwissSyrianTaiwaneseThaiTlingit-HaidaTohono O'OdhamTonganTrinidadian and TobagonianTsimshianTurkishU.S. Virgin IslanderUgandanUkrainianUruguayanUteVenezuelanVietnameseWelshWest IndianYakamaYaquiYugoslavianYumanYup'ikZimbabwean
Immigration
NonimmigrantsImmigrantsAfghanistanAfricaAlbaniaArgentinaArmeniaAsiaAustraliaAustriaBahamasBangladeshBarbadosBelarusBelgiumBelizeBoliviaBosnia and HerzegovinaBrazilBulgariaBurma/MyanmarCabo VerdeCambodiaCameroonCanadaCaribbeanCentral AmericaChileChinaColombiaCongoCosta RicaCroatiaCubaCzechoslovakiaDenmarkDominicaDominican RepublicEastern AfricaEastern AsiaEastern EuropeEcuadorEgyptEl SalvadorEnglandEritreaEthiopiaEuropeFijiFranceGermanyGhanaGreeceGrenadaGuatemalaGuyanaHaitiHondurasHong KongHungaryIndiaIndonesiaIranIraqIrelandIsraelItalyJamaicaJapanJordanKazakhstanKenyaKoreaKuwaitLaosLatin AmericaLatviaLebanonLiberiaLithuaniaMalaysiaMexicoMicronesiaMiddle AfricaMoldovaMoroccoNepalNetherlandsNicaraguaNigeriaNorth AmericaNorth MacedoniaNorthern AfricaNorthern EuropeNorwayOceaniaPakistanPanamaPeruPhilippinesPolandPortugalRussiaSaudi ArabiaScotlandSenegalSerbiaSierra LeoneSingaporeSomaliaSouth AfricaSouth AmericaSouth Central AsiaSouth Eastern AsiaSouthern EuropeSpainSri LankaSt. Vincent and the GrenadinesSudanSwedenSwitzerlandSyriaTaiwanThailandTrinidad and TobagoTurkeyUgandaUkraineUruguayUzbekistanVenezuelaVietnamWest IndiesWestern AfricaWestern AsiaWestern EuropeYemenZaireZimbabweAzores
Child Poverty Under the Age of 16
Income
Poverty
Unemployment
Labor Participation
Family Structure
Vehicle Availability
Education Level
Disability

Child Poverty Under the Age of 16 Comparison

Immigrants from Romania

Aleuts

Exceptional
Poor
14.2%
CHILD POVERTY UNDER THE AGE OF 16
98.3/ 100
METRIC RATING
64th/ 347
METRIC RANK
17.1%
CHILD POVERTY UNDER THE AGE OF 16
13.9/ 100
METRIC RATING
205th/ 347
METRIC RANK

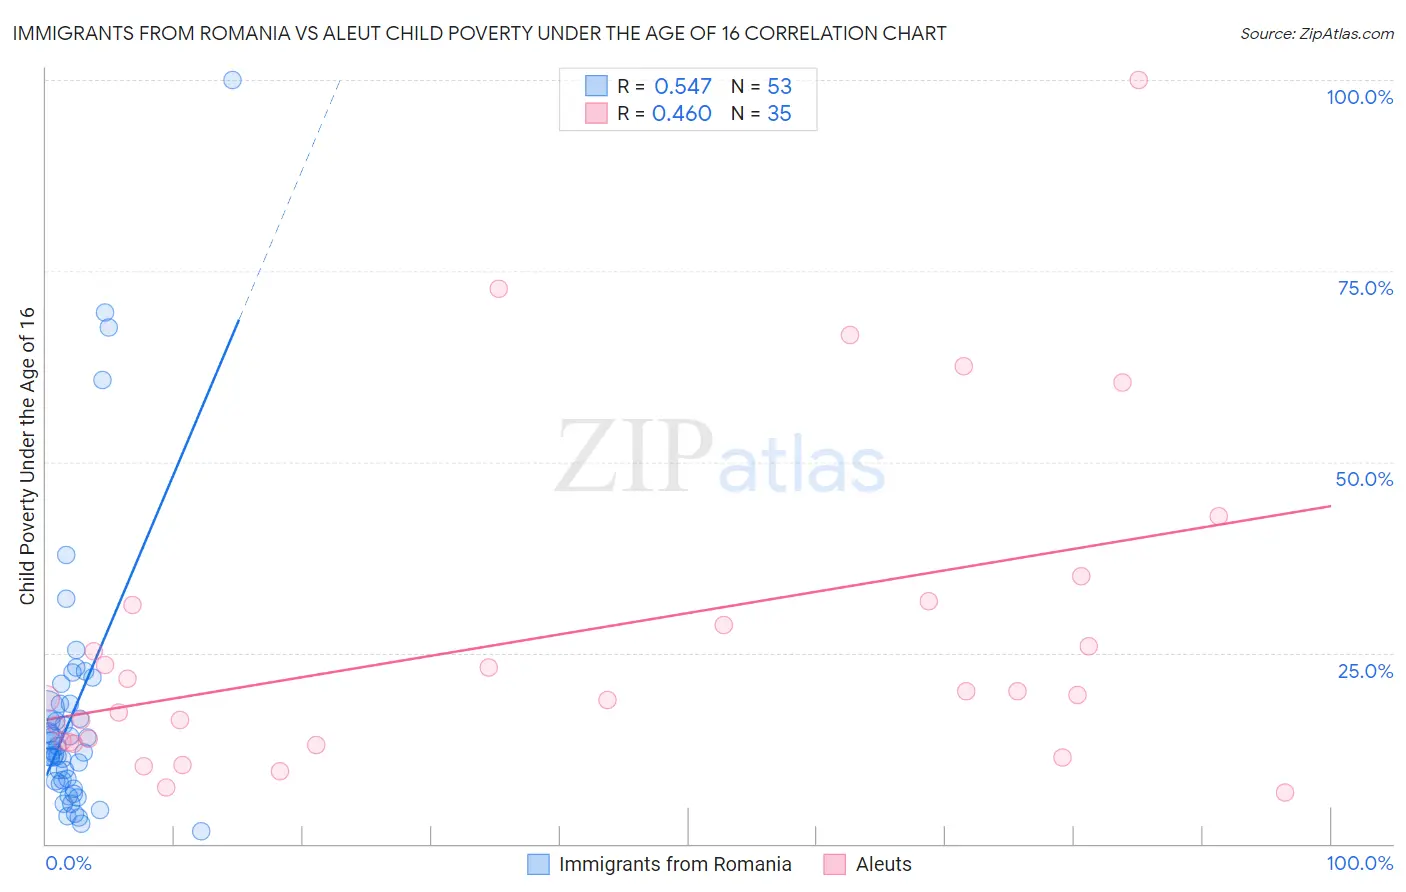
Immigrants from Romania vs Aleut Child Poverty Under the Age of 16 Correlation Chart

The statistical analysis conducted on geographies consisting of 255,520,974 people shows a substantial positive correlation between the proportion of Immigrants from Romania and poverty level among children under the age of 16 in the United States with a correlation coefficient (R) of 0.547 and weighted average of 14.2%. Similarly, the statistical analysis conducted on geographies consisting of 61,640,515 people shows a moderate positive correlation between the proportion of Aleuts and poverty level among children under the age of 16 in the United States with a correlation coefficient (R) of 0.460 and weighted average of 17.1%, a difference of 20.1%.
Immigrants from Romania vs Aleut Child Poverty Under the Age of 16

Child Poverty Under the Age of 16 Correlation Summary

MeasurementImmigrants from RomaniaAleut
Minimum1.6%6.7%
Maximum100.0%100.0%
Range98.4%93.3%
Mean17.6%26.7%
Median12.2%19.4%
Interquartile 25% (IQ1)8.0%13.2%
Interquartile 75% (IQ3)18.3%31.2%
Interquartile Range (IQR)10.3%18.1%
Standard Deviation (Sample)18.4%21.3%
Standard Deviation (Population)18.2%21.0%

Similar Demographics by Child Poverty Under the Age of 16

Demographics Similar to Immigrants from Romania by Child Poverty Under the Age of 16

In terms of child poverty under the age of 16, the demographic groups most similar to Immigrants from Romania are Immigrants from Europe (14.2%, a difference of 0.13%), Immigrants from Philippines (14.3%, a difference of 0.26%), Zimbabwean (14.2%, a difference of 0.44%), Slovene (14.3%, a difference of 0.44%), and Immigrants from Sweden (14.2%, a difference of 0.45%).
DemographicsRating | RankChild Poverty Under the Age of 16
Immigrants | Belgium
98.6
/100
|
#57
Exceptional
14.1%
Immigrants | Pakistan
98.6
/100
|
#58
Exceptional
14.1%
Scandinavians
98.6
/100
|
#59
Exceptional
14.1%
Immigrants | Austria
98.5
/100
|
#60
Exceptional
14.2%
Immigrants | Sweden
98.5
/100
|
#61
Exceptional
14.2%
Zimbabweans
98.5
/100
|
#62
Exceptional
14.2%
Immigrants | Europe
98.4
/100
|
#63
Exceptional
14.2%
Immigrants | Romania
98.3
/100
|
#64
Exceptional
14.2%
Immigrants | Philippines
98.2
/100
|
#65
Exceptional
14.3%
Slovenes
98.1
/100
|
#66
Exceptional
14.3%
Europeans
98.1
/100
|
#67
Exceptional
14.3%
Laotians
98.0
/100
|
#68
Exceptional
14.3%
Immigrants | Bulgaria
98.0
/100
|
#69
Exceptional
14.3%
Immigrants | Netherlands
97.9
/100
|
#70
Exceptional
14.3%
Immigrants | Poland
97.9
/100
|
#71
Exceptional
14.3%

Demographics Similar to Aleuts by Child Poverty Under the Age of 16

In terms of child poverty under the age of 16, the demographic groups most similar to Aleuts are Hmong (17.1%, a difference of 0.010%), Immigrants from Sierra Leone (17.1%, a difference of 0.070%), Ugandan (17.1%, a difference of 0.090%), Immigrants from Uzbekistan (17.1%, a difference of 0.17%), and Immigrants from Cameroon (17.1%, a difference of 0.18%).
DemographicsRating | RankChild Poverty Under the Age of 16
Delaware
17.1
/100
|
#198
Poor
17.0%
Immigrants | Afghanistan
15.1
/100
|
#199
Poor
17.0%
Immigrants | Cameroon
14.7
/100
|
#200
Poor
17.1%
Immigrants | Uzbekistan
14.7
/100
|
#201
Poor
17.1%
Ugandans
14.3
/100
|
#202
Poor
17.1%
Immigrants | Sierra Leone
14.2
/100
|
#203
Poor
17.1%
Hmong
14.0
/100
|
#204
Poor
17.1%
Aleuts
13.9
/100
|
#205
Poor
17.1%
Alaska Natives
11.8
/100
|
#206
Poor
17.2%
German Russians
8.6
/100
|
#207
Tragic
17.4%
Pennsylvania Germans
7.5
/100
|
#208
Tragic
17.4%
Panamanians
6.9
/100
|
#209
Tragic
17.5%
Alaskan Athabascans
6.9
/100
|
#210
Tragic
17.5%
Immigrants | Thailand
6.6
/100
|
#211
Tragic
17.5%
Immigrants | Immigrants
6.5
/100
|
#212
Tragic
17.5%