Immigrants from Portugal vs Cree Female Poverty
COMPARE
Immigrants from Portugal
Cree
Female Poverty
Female Poverty Comparison
Immigrants from Portugal
Cree
13.6%
FEMALE POVERTY
41.5/ 100
METRIC RATING
186th/ 347
METRIC RANK
15.1%
FEMALE POVERTY
0.7/ 100
METRIC RATING
236th/ 347
METRIC RANK
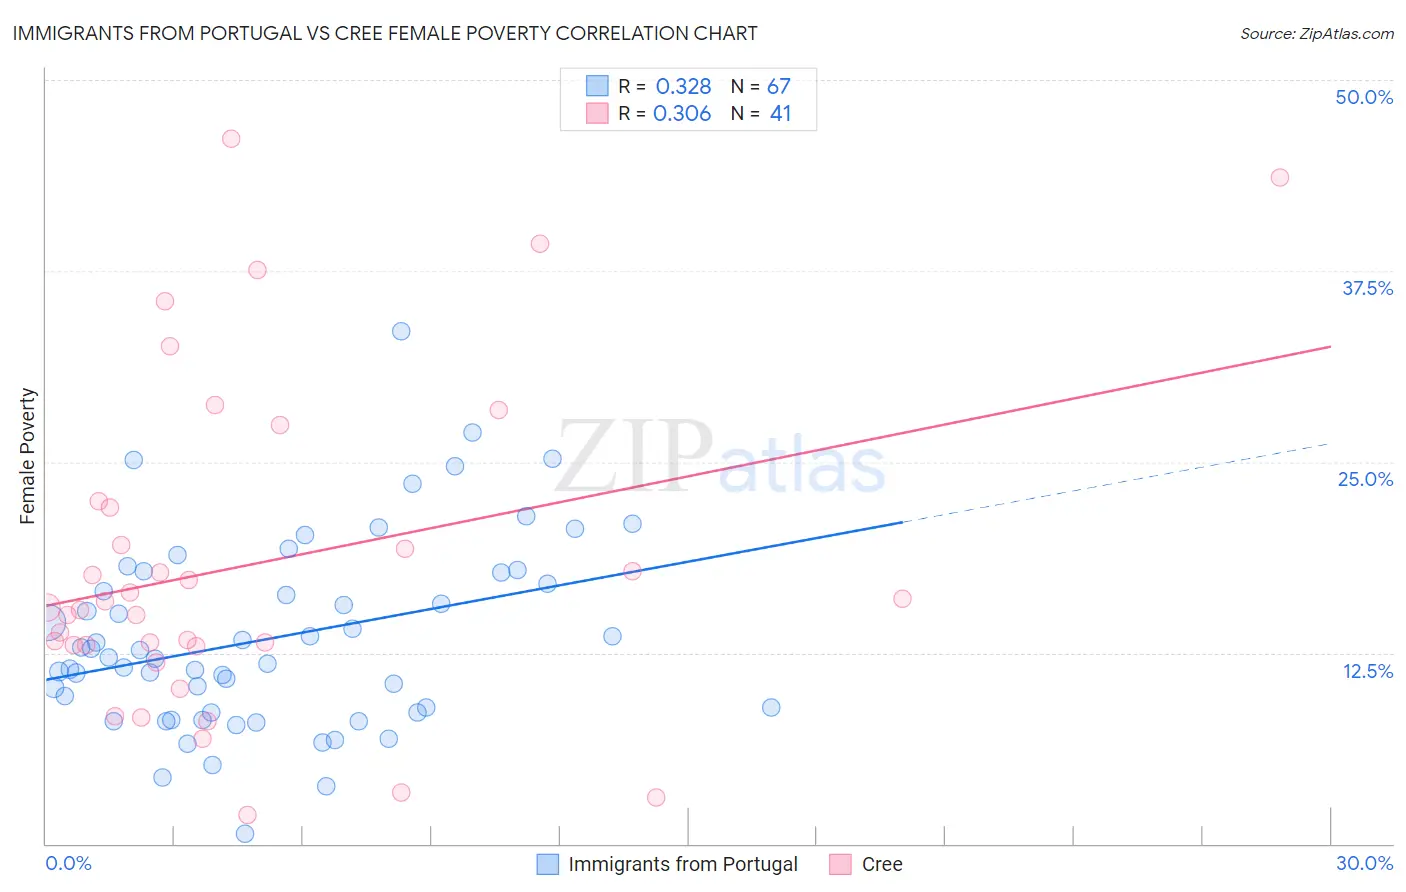
Immigrants from Portugal vs Cree Female Poverty Correlation Chart
The statistical analysis conducted on geographies consisting of 174,717,280 people shows a mild positive correlation between the proportion of Immigrants from Portugal and poverty level among females in the United States with a correlation coefficient (R) of 0.328 and weighted average of 13.6%. Similarly, the statistical analysis conducted on geographies consisting of 76,205,859 people shows a mild positive correlation between the proportion of Cree and poverty level among females in the United States with a correlation coefficient (R) of 0.306 and weighted average of 15.1%, a difference of 11.1%.
Female Poverty Correlation Summary
| Measurement | Immigrants from Portugal | Cree |
| Minimum | 0.65% | 1.9% |
| Maximum | 33.6% | 46.1% |
| Range | 32.9% | 44.3% |
| Mean | 13.5% | 18.3% |
| Median | 12.2% | 15.5% |
| Interquartile 25% (IQ1) | 8.6% | 13.0% |
| Interquartile 75% (IQ3) | 17.8% | 22.2% |
| Interquartile Range (IQR) | 9.1% | 9.2% |
| Standard Deviation (Sample) | 6.2% | 10.7% |
| Standard Deviation (Population) | 6.1% | 10.6% |
Similar Demographics by Female Poverty
Demographics Similar to Immigrants from Portugal by Female Poverty
In terms of female poverty, the demographic groups most similar to Immigrants from Portugal are Immigrants from Venezuela (13.6%, a difference of 0.050%), Immigrants from Cameroon (13.5%, a difference of 0.060%), Hawaiian (13.6%, a difference of 0.16%), Immigrants from Sierra Leone (13.5%, a difference of 0.17%), and Uruguayan (13.6%, a difference of 0.17%).
| Demographics | Rating | Rank | Female Poverty |
| Immigrants | Syria | 48.8 /100 | #179 | Average 13.5% |
| South Americans | 44.8 /100 | #180 | Average 13.5% |
| Venezuelans | 44.5 /100 | #181 | Average 13.5% |
| Immigrants | Colombia | 44.5 /100 | #182 | Average 13.5% |
| Kenyans | 43.8 /100 | #183 | Average 13.5% |
| Immigrants | Sierra Leone | 43.2 /100 | #184 | Average 13.5% |
| Immigrants | Cameroon | 42.0 /100 | #185 | Average 13.5% |
| Immigrants | Portugal | 41.5 /100 | #186 | Average 13.6% |
| Immigrants | Venezuela | 41.0 /100 | #187 | Average 13.6% |
| Hawaiians | 39.9 /100 | #188 | Fair 13.6% |
| Uruguayans | 39.8 /100 | #189 | Fair 13.6% |
| Sierra Leoneans | 33.1 /100 | #190 | Fair 13.7% |
| Immigrants | Kuwait | 32.7 /100 | #191 | Fair 13.7% |
| Immigrants | Costa Rica | 31.9 /100 | #192 | Fair 13.7% |
| Iraqis | 31.8 /100 | #193 | Fair 13.7% |
Demographics Similar to Cree by Female Poverty
In terms of female poverty, the demographic groups most similar to Cree are French American Indian (15.1%, a difference of 0.19%), Immigrants from Armenia (15.1%, a difference of 0.26%), Immigrants from Laos (15.0%, a difference of 0.63%), Immigrants from Middle Africa (15.2%, a difference of 0.78%), and Sudanese (15.2%, a difference of 0.84%).
| Demographics | Rating | Rank | Female Poverty |
| Ghanaians | 1.9 /100 | #229 | Tragic 14.7% |
| Alaska Natives | 1.8 /100 | #230 | Tragic 14.7% |
| Nigerians | 1.7 /100 | #231 | Tragic 14.8% |
| Osage | 1.5 /100 | #232 | Tragic 14.8% |
| Immigrants | Saudi Arabia | 1.4 /100 | #233 | Tragic 14.8% |
| Fijians | 1.1 /100 | #234 | Tragic 14.9% |
| Immigrants | Laos | 0.9 /100 | #235 | Tragic 15.0% |
| Cree | 0.7 /100 | #236 | Tragic 15.1% |
| French American Indians | 0.6 /100 | #237 | Tragic 15.1% |
| Immigrants | Armenia | 0.6 /100 | #238 | Tragic 15.1% |
| Immigrants | Middle Africa | 0.5 /100 | #239 | Tragic 15.2% |
| Sudanese | 0.5 /100 | #240 | Tragic 15.2% |
| Immigrants | Sudan | 0.4 /100 | #241 | Tragic 15.2% |
| Nepalese | 0.4 /100 | #242 | Tragic 15.2% |
| Nicaraguans | 0.3 /100 | #243 | Tragic 15.3% |