Immigrants from Poland vs Slavic Single Female Poverty
COMPARE
Immigrants from Poland
Slavic
Single Female Poverty
Single Female Poverty Comparison
Immigrants from Poland
Slavs
18.5%
SINGLE FEMALE POVERTY
100.0/ 100
METRIC RATING
29th/ 347
METRIC RANK
21.1%
SINGLE FEMALE POVERTY
40.5/ 100
METRIC RATING
182nd/ 347
METRIC RANK
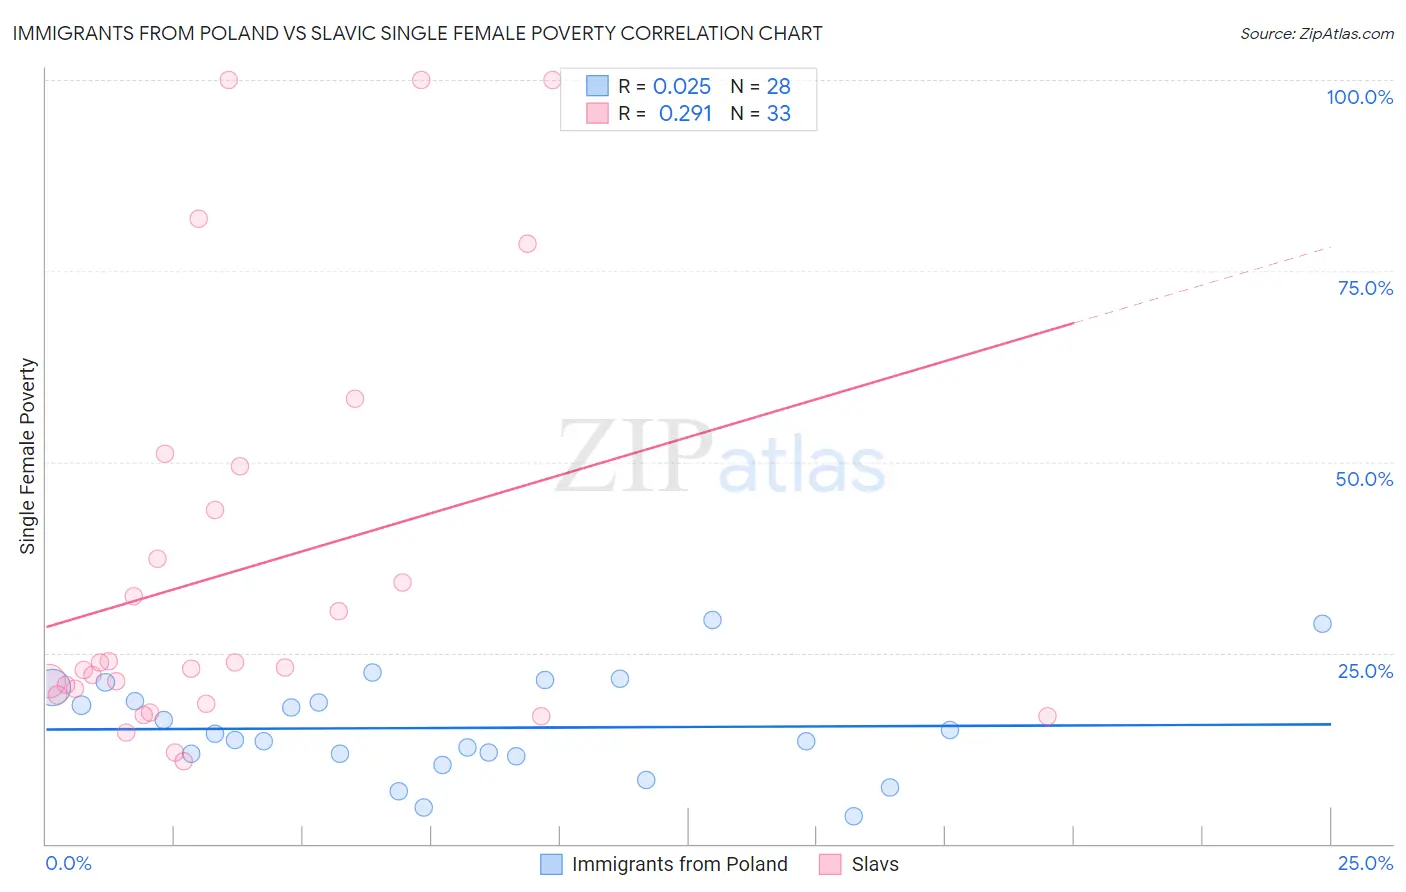
Immigrants from Poland vs Slavic Single Female Poverty Correlation Chart
The statistical analysis conducted on geographies consisting of 299,755,807 people shows no correlation between the proportion of Immigrants from Poland and poverty level among single females in the United States with a correlation coefficient (R) of 0.025 and weighted average of 18.5%. Similarly, the statistical analysis conducted on geographies consisting of 267,477,501 people shows a weak positive correlation between the proportion of Slavs and poverty level among single females in the United States with a correlation coefficient (R) of 0.291 and weighted average of 21.1%, a difference of 14.1%.
Single Female Poverty Correlation Summary
| Measurement | Immigrants from Poland | Slavic |
| Minimum | 3.7% | 10.9% |
| Maximum | 29.2% | 100.0% |
| Range | 25.6% | 89.1% |
| Mean | 15.2% | 35.9% |
| Median | 14.0% | 23.1% |
| Interquartile 25% (IQ1) | 11.6% | 18.9% |
| Interquartile 75% (IQ3) | 19.6% | 46.5% |
| Interquartile Range (IQR) | 8.0% | 27.7% |
| Standard Deviation (Sample) | 6.4% | 26.8% |
| Standard Deviation (Population) | 6.3% | 26.4% |
Similar Demographics by Single Female Poverty
Demographics Similar to Immigrants from Poland by Single Female Poverty
In terms of single female poverty, the demographic groups most similar to Immigrants from Poland are Immigrants from Moldova (18.5%, a difference of 0.10%), Immigrants from North Macedonia (18.5%, a difference of 0.16%), Immigrants from Asia (18.6%, a difference of 0.21%), Immigrants from Sri Lanka (18.6%, a difference of 0.29%), and Immigrants from Philippines (18.6%, a difference of 0.36%).
| Demographics | Rating | Rank | Single Female Poverty |
| Burmese | 100.0 /100 | #22 | Exceptional 18.3% |
| Asians | 100.0 /100 | #23 | Exceptional 18.3% |
| Armenians | 100.0 /100 | #24 | Exceptional 18.3% |
| Immigrants | Singapore | 100.0 /100 | #25 | Exceptional 18.3% |
| Immigrants | Israel | 100.0 /100 | #26 | Exceptional 18.3% |
| Immigrants | Pakistan | 100.0 /100 | #27 | Exceptional 18.4% |
| Immigrants | Moldova | 100.0 /100 | #28 | Exceptional 18.5% |
| Immigrants | Poland | 100.0 /100 | #29 | Exceptional 18.5% |
| Immigrants | North Macedonia | 99.9 /100 | #30 | Exceptional 18.5% |
| Immigrants | Asia | 99.9 /100 | #31 | Exceptional 18.6% |
| Immigrants | Sri Lanka | 99.9 /100 | #32 | Exceptional 18.6% |
| Immigrants | Philippines | 99.9 /100 | #33 | Exceptional 18.6% |
| Koreans | 99.9 /100 | #34 | Exceptional 18.6% |
| Immigrants | Japan | 99.9 /100 | #35 | Exceptional 18.6% |
| Turks | 99.9 /100 | #36 | Exceptional 18.7% |
Demographics Similar to Slavs by Single Female Poverty
In terms of single female poverty, the demographic groups most similar to Slavs are Slovak (21.1%, a difference of 0.050%), Hungarian (21.1%, a difference of 0.060%), Spanish American Indian (21.1%, a difference of 0.12%), European (21.1%, a difference of 0.12%), and British (21.1%, a difference of 0.15%).
| Demographics | Rating | Rank | Single Female Poverty |
| Czechs | 46.8 /100 | #175 | Average 21.0% |
| Canadians | 45.4 /100 | #176 | Average 21.1% |
| Scandinavians | 45.2 /100 | #177 | Average 21.1% |
| Immigrants | Bosnia and Herzegovina | 44.9 /100 | #178 | Average 21.1% |
| British | 42.9 /100 | #179 | Average 21.1% |
| Spanish American Indians | 42.5 /100 | #180 | Average 21.1% |
| Europeans | 42.3 /100 | #181 | Average 21.1% |
| Slavs | 40.5 /100 | #182 | Average 21.1% |
| Slovaks | 39.7 /100 | #183 | Fair 21.1% |
| Hungarians | 39.6 /100 | #184 | Fair 21.1% |
| Immigrants | Cambodia | 38.2 /100 | #185 | Fair 21.2% |
| Hawaiians | 37.7 /100 | #186 | Fair 21.2% |
| Immigrants | Nigeria | 36.8 /100 | #187 | Fair 21.2% |
| Yugoslavians | 35.4 /100 | #188 | Fair 21.2% |
| Immigrants | Cuba | 35.3 /100 | #189 | Fair 21.2% |