Immigrants from Poland vs Portuguese Seniors Poverty Over the Age of 65
COMPARE
Immigrants from Poland
Portuguese
Seniors Poverty Over the Age of 65
Seniors Poverty Over the Age of 65 Comparison
Immigrants from Poland
Portuguese
10.1%
SENIORS POVERTY OVER THE AGE OF 65
97.2/ 100
METRIC RATING
83rd/ 347
METRIC RANK
10.5%
SENIORS POVERTY OVER THE AGE OF 65
84.1/ 100
METRIC RATING
139th/ 347
METRIC RANK
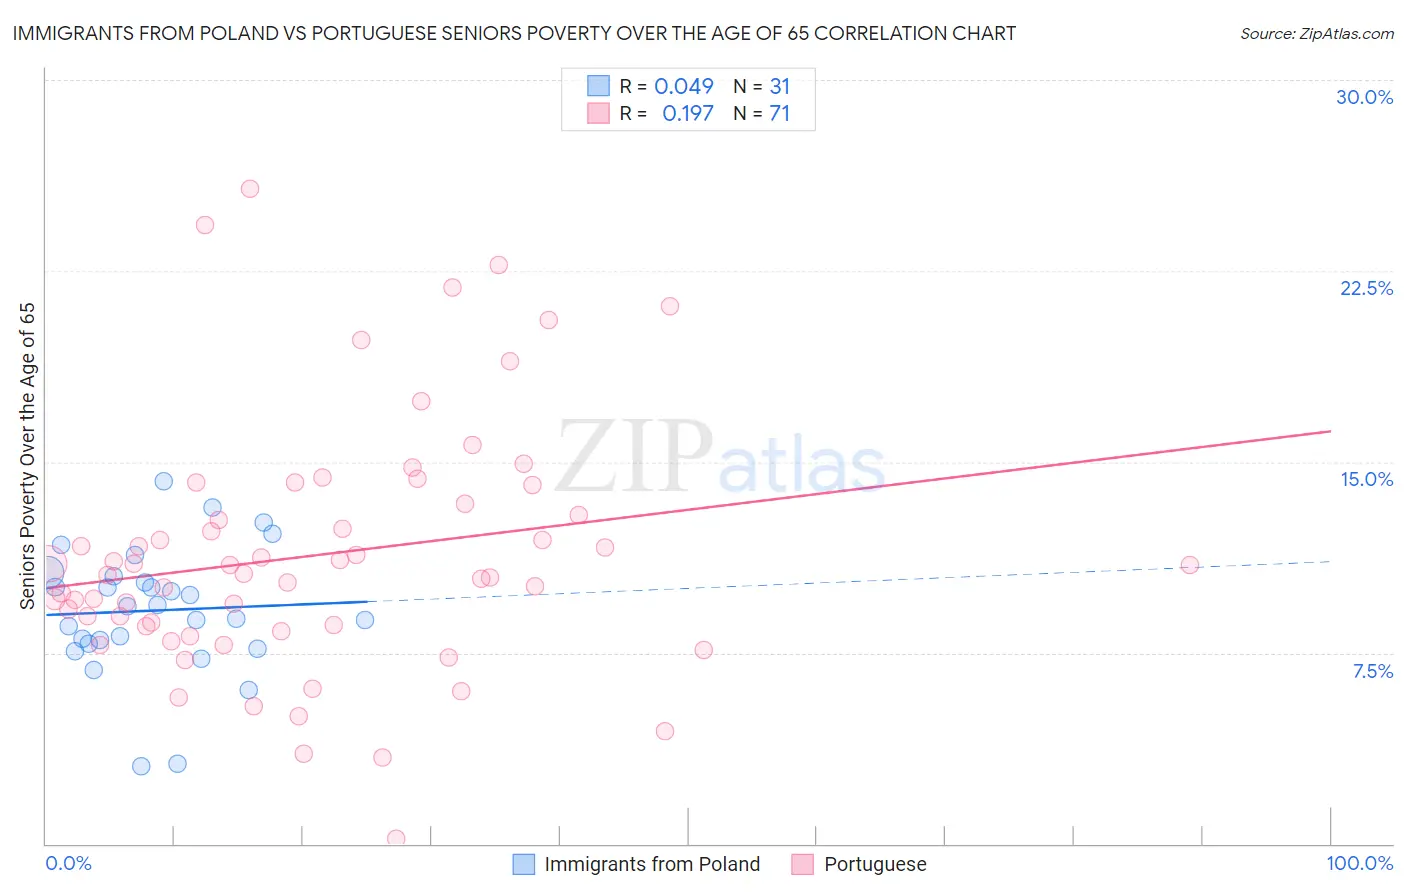
Immigrants from Poland vs Portuguese Seniors Poverty Over the Age of 65 Correlation Chart
The statistical analysis conducted on geographies consisting of 304,182,133 people shows no correlation between the proportion of Immigrants from Poland and poverty level among seniors over the age of 65 in the United States with a correlation coefficient (R) of 0.049 and weighted average of 10.1%. Similarly, the statistical analysis conducted on geographies consisting of 447,984,891 people shows a poor positive correlation between the proportion of Portuguese and poverty level among seniors over the age of 65 in the United States with a correlation coefficient (R) of 0.197 and weighted average of 10.5%, a difference of 4.6%.
Seniors Poverty Over the Age of 65 Correlation Summary
| Measurement | Immigrants from Poland | Portuguese |
| Minimum | 3.0% | 0.21% |
| Maximum | 14.3% | 25.7% |
| Range | 11.2% | 25.5% |
| Mean | 9.2% | 11.3% |
| Median | 9.3% | 10.6% |
| Interquartile 25% (IQ1) | 7.8% | 8.5% |
| Interquartile 75% (IQ3) | 10.5% | 13.4% |
| Interquartile Range (IQR) | 2.7% | 4.8% |
| Standard Deviation (Sample) | 2.5% | 4.9% |
| Standard Deviation (Population) | 2.5% | 4.9% |
Similar Demographics by Seniors Poverty Over the Age of 65
Demographics Similar to Immigrants from Poland by Seniors Poverty Over the Age of 65
In terms of seniors poverty over the age of 65, the demographic groups most similar to Immigrants from Poland are Immigrants from Bolivia (10.1%, a difference of 0.030%), Immigrants from Afghanistan (10.1%, a difference of 0.030%), Immigrants from Nepal (10.1%, a difference of 0.030%), Romanian (10.1%, a difference of 0.050%), and Burmese (10.1%, a difference of 0.060%).
| Demographics | Rating | Rank | Seniors Poverty Over the Age of 65 |
| New Zealanders | 97.7 /100 | #76 | Exceptional 10.0% |
| Immigrants | South Africa | 97.7 /100 | #77 | Exceptional 10.0% |
| Whites/Caucasians | 97.5 /100 | #78 | Exceptional 10.0% |
| Immigrants | Ireland | 97.5 /100 | #79 | Exceptional 10.0% |
| Koreans | 97.4 /100 | #80 | Exceptional 10.1% |
| Immigrants | Sri Lanka | 97.3 /100 | #81 | Exceptional 10.1% |
| Immigrants | Bolivia | 97.3 /100 | #82 | Exceptional 10.1% |
| Immigrants | Poland | 97.2 /100 | #83 | Exceptional 10.1% |
| Immigrants | Afghanistan | 97.2 /100 | #84 | Exceptional 10.1% |
| Immigrants | Nepal | 97.2 /100 | #85 | Exceptional 10.1% |
| Romanians | 97.2 /100 | #86 | Exceptional 10.1% |
| Burmese | 97.2 /100 | #87 | Exceptional 10.1% |
| Jordanians | 97.1 /100 | #88 | Exceptional 10.1% |
| Immigrants | Bulgaria | 97.0 /100 | #89 | Exceptional 10.1% |
| Ukrainians | 96.9 /100 | #90 | Exceptional 10.1% |
Demographics Similar to Portuguese by Seniors Poverty Over the Age of 65
In terms of seniors poverty over the age of 65, the demographic groups most similar to Portuguese are Immigrants from Latvia (10.5%, a difference of 0.10%), Immigrants from Kenya (10.5%, a difference of 0.13%), Immigrants from Europe (10.5%, a difference of 0.15%), Immigrants from Australia (10.5%, a difference of 0.16%), and Osage (10.6%, a difference of 0.22%).
| Demographics | Rating | Rank | Seniors Poverty Over the Age of 65 |
| Immigrants | Turkey | 87.7 /100 | #132 | Excellent 10.5% |
| Guamanians/Chamorros | 87.5 /100 | #133 | Excellent 10.5% |
| Sierra Leoneans | 86.8 /100 | #134 | Excellent 10.5% |
| Immigrants | Norway | 86.5 /100 | #135 | Excellent 10.5% |
| Immigrants | Serbia | 86.4 /100 | #136 | Excellent 10.5% |
| Immigrants | Australia | 85.1 /100 | #137 | Excellent 10.5% |
| Immigrants | Latvia | 84.7 /100 | #138 | Excellent 10.5% |
| Portuguese | 84.1 /100 | #139 | Excellent 10.5% |
| Immigrants | Kenya | 83.4 /100 | #140 | Excellent 10.5% |
| Immigrants | Europe | 83.3 /100 | #141 | Excellent 10.5% |
| Osage | 82.8 /100 | #142 | Excellent 10.6% |
| Immigrants | Asia | 80.8 /100 | #143 | Excellent 10.6% |
| Iraqis | 80.7 /100 | #144 | Excellent 10.6% |
| Laotians | 79.9 /100 | #145 | Good 10.6% |
| Alaskan Athabascans | 79.1 /100 | #146 | Good 10.6% |