Immigrants from Poland vs Immigrants from Western Europe Receiving Food Stamps
COMPARE
Immigrants from Poland
Immigrants from Western Europe
Receiving Food Stamps
Receiving Food Stamps Comparison
Immigrants from Poland
Immigrants from Western Europe
10.6%
RECEIVING FOOD STAMPS
93.9/ 100
METRIC RATING
119th/ 347
METRIC RANK
10.3%
RECEIVING FOOD STAMPS
96.9/ 100
METRIC RATING
100th/ 347
METRIC RANK
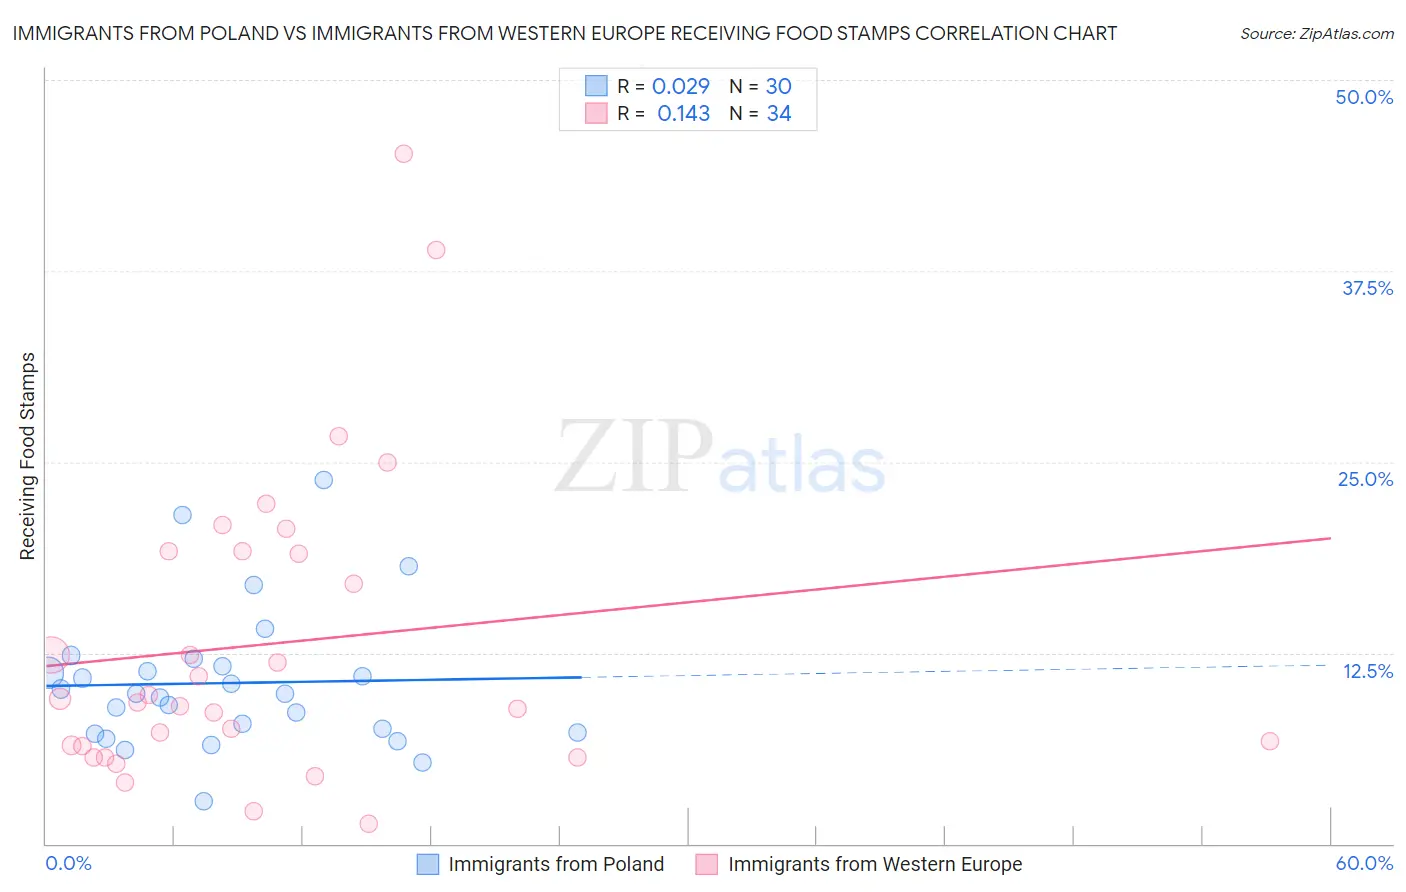
Immigrants from Poland vs Immigrants from Western Europe Receiving Food Stamps Correlation Chart
The statistical analysis conducted on geographies consisting of 304,061,523 people shows no correlation between the proportion of Immigrants from Poland and percentage of population receiving government assistance and/or food stamps in the United States with a correlation coefficient (R) of 0.029 and weighted average of 10.6%. Similarly, the statistical analysis conducted on geographies consisting of 492,068,857 people shows a poor positive correlation between the proportion of Immigrants from Western Europe and percentage of population receiving government assistance and/or food stamps in the United States with a correlation coefficient (R) of 0.143 and weighted average of 10.3%, a difference of 2.8%.
Receiving Food Stamps Correlation Summary
| Measurement | Immigrants from Poland | Immigrants from Western Europe |
| Minimum | 2.8% | 1.3% |
| Maximum | 23.8% | 45.2% |
| Range | 21.0% | 43.9% |
| Mean | 10.5% | 13.1% |
| Median | 9.8% | 9.4% |
| Interquartile 25% (IQ1) | 7.3% | 6.4% |
| Interquartile 75% (IQ3) | 11.6% | 19.1% |
| Interquartile Range (IQR) | 4.3% | 12.8% |
| Standard Deviation (Sample) | 4.6% | 10.0% |
| Standard Deviation (Population) | 4.5% | 9.8% |
Demographics Similar to Immigrants from Poland and Immigrants from Western Europe by Receiving Food Stamps
In terms of receiving food stamps, the demographic groups most similar to Immigrants from Poland are Assyrian/Chaldean/Syriac (10.6%, a difference of 0.16%), Immigrants from Nepal (10.6%, a difference of 0.50%), Canadian (10.5%, a difference of 0.66%), Immigrants from Saudi Arabia (10.5%, a difference of 0.71%), and Scotch-Irish (10.5%, a difference of 0.89%). Similarly, the demographic groups most similar to Immigrants from Western Europe are Palestinian (10.3%, a difference of 0.0%), Immigrants from Europe (10.3%, a difference of 0.090%), Serbian (10.3%, a difference of 0.12%), Immigrants from Latvia (10.3%, a difference of 0.18%), and Immigrants from Hungary (10.3%, a difference of 0.20%).
| Demographics | Rating | Rank | Receiving Food Stamps |
| Serbians | 97.0 /100 | #99 | Exceptional 10.3% |
| Immigrants | Western Europe | 96.9 /100 | #100 | Exceptional 10.3% |
| Palestinians | 96.9 /100 | #101 | Exceptional 10.3% |
| Immigrants | Europe | 96.8 /100 | #102 | Exceptional 10.3% |
| Immigrants | Latvia | 96.8 /100 | #103 | Exceptional 10.3% |
| Immigrants | Hungary | 96.7 /100 | #104 | Exceptional 10.3% |
| Immigrants | Malaysia | 96.5 /100 | #105 | Exceptional 10.4% |
| Immigrants | Italy | 96.4 /100 | #106 | Exceptional 10.4% |
| Koreans | 96.3 /100 | #107 | Exceptional 10.4% |
| Carpatho Rusyns | 96.2 /100 | #108 | Exceptional 10.4% |
| Immigrants | Pakistan | 96.2 /100 | #109 | Exceptional 10.4% |
| Pakistanis | 95.9 /100 | #110 | Exceptional 10.4% |
| Romanians | 95.8 /100 | #111 | Exceptional 10.4% |
| Mongolians | 95.8 /100 | #112 | Exceptional 10.5% |
| Icelanders | 95.4 /100 | #113 | Exceptional 10.5% |
| Scotch-Irish | 95.1 /100 | #114 | Exceptional 10.5% |
| Immigrants | Saudi Arabia | 94.9 /100 | #115 | Exceptional 10.5% |
| Canadians | 94.8 /100 | #116 | Exceptional 10.5% |
| Immigrants | Nepal | 94.6 /100 | #117 | Exceptional 10.6% |
| Assyrians/Chaldeans/Syriacs | 94.1 /100 | #118 | Exceptional 10.6% |
| Immigrants | Poland | 93.9 /100 | #119 | Exceptional 10.6% |