Immigrants from Philippines vs Immigrants from Northern Africa Child Poverty Under the Age of 16
COMPARE
Immigrants from Philippines
Immigrants from Northern Africa
Child Poverty Under the Age of 16
Child Poverty Under the Age of 16 Comparison
Immigrants from Philippines
Immigrants from Northern Africa
14.3%
CHILD POVERTY UNDER THE AGE OF 16
98.2/ 100
METRIC RATING
65th/ 347
METRIC RANK
15.8%
CHILD POVERTY UNDER THE AGE OF 16
68.1/ 100
METRIC RATING
161st/ 347
METRIC RANK
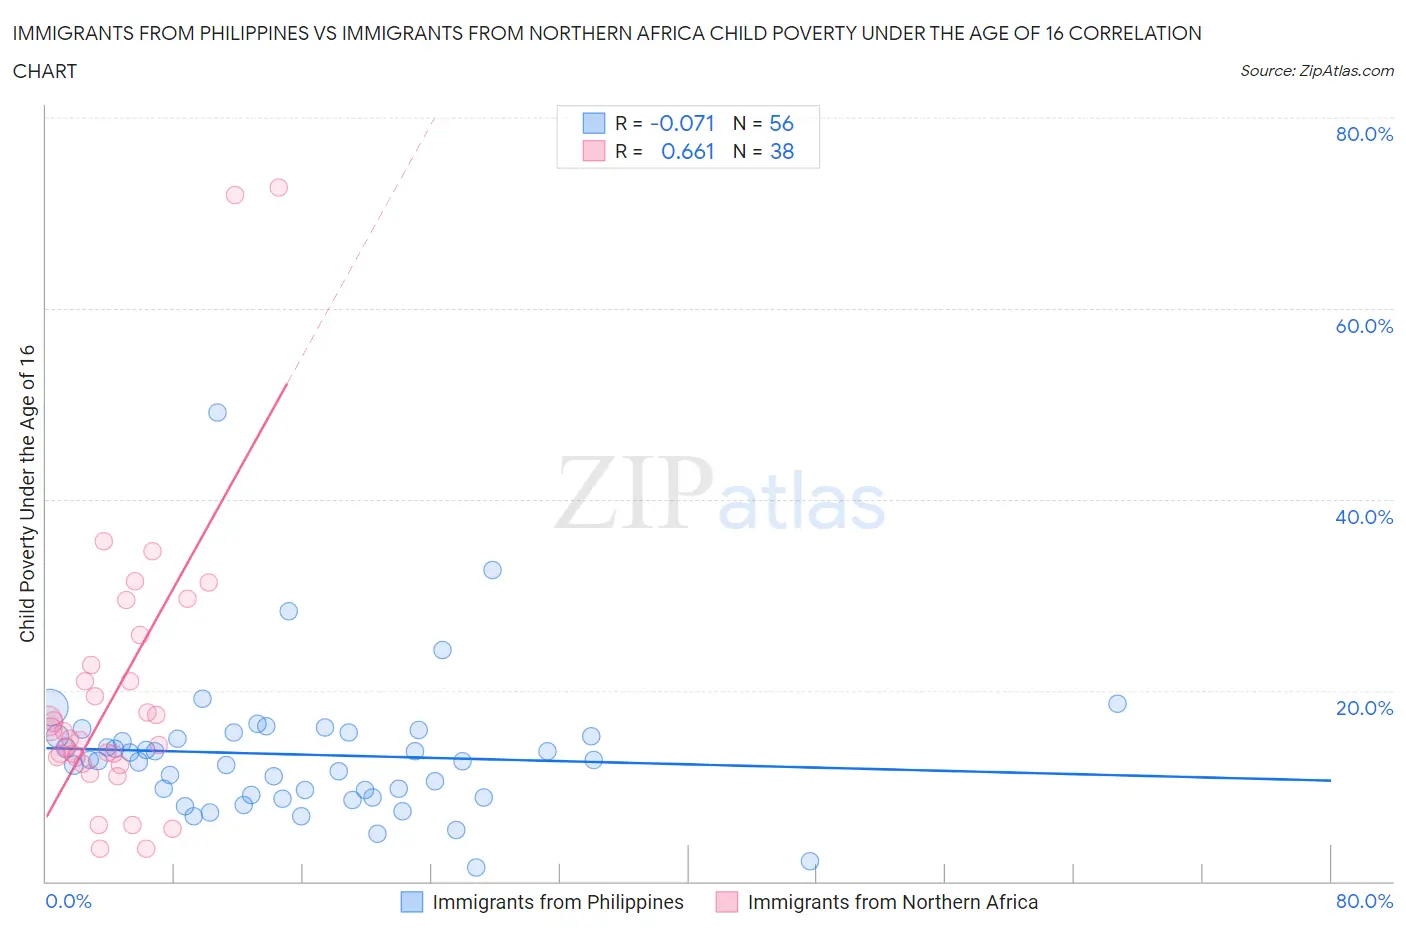
Immigrants from Philippines vs Immigrants from Northern Africa Child Poverty Under the Age of 16 Correlation Chart
The statistical analysis conducted on geographies consisting of 466,147,188 people shows a slight negative correlation between the proportion of Immigrants from Philippines and poverty level among children under the age of 16 in the United States with a correlation coefficient (R) of -0.071 and weighted average of 14.3%. Similarly, the statistical analysis conducted on geographies consisting of 319,048,097 people shows a significant positive correlation between the proportion of Immigrants from Northern Africa and poverty level among children under the age of 16 in the United States with a correlation coefficient (R) of 0.661 and weighted average of 15.8%, a difference of 11.0%.
Child Poverty Under the Age of 16 Correlation Summary
| Measurement | Immigrants from Philippines | Immigrants from Northern Africa |
| Minimum | 1.4% | 3.4% |
| Maximum | 49.1% | 72.6% |
| Range | 47.7% | 69.3% |
| Mean | 13.3% | 19.9% |
| Median | 12.7% | 15.3% |
| Interquartile 25% (IQ1) | 8.9% | 13.0% |
| Interquartile 75% (IQ3) | 15.4% | 22.6% |
| Interquartile Range (IQR) | 6.5% | 9.7% |
| Standard Deviation (Sample) | 7.3% | 15.0% |
| Standard Deviation (Population) | 7.3% | 14.8% |
Similar Demographics by Child Poverty Under the Age of 16
Demographics Similar to Immigrants from Philippines by Child Poverty Under the Age of 16
In terms of child poverty under the age of 16, the demographic groups most similar to Immigrants from Philippines are Slovene (14.3%, a difference of 0.18%), European (14.3%, a difference of 0.21%), Immigrants from Romania (14.2%, a difference of 0.26%), Laotian (14.3%, a difference of 0.31%), and Immigrants from Europe (14.2%, a difference of 0.39%).
| Demographics | Rating | Rank | Child Poverty Under the Age of 16 |
| Immigrants | Pakistan | 98.6 /100 | #58 | Exceptional 14.1% |
| Scandinavians | 98.6 /100 | #59 | Exceptional 14.1% |
| Immigrants | Austria | 98.5 /100 | #60 | Exceptional 14.2% |
| Immigrants | Sweden | 98.5 /100 | #61 | Exceptional 14.2% |
| Zimbabweans | 98.5 /100 | #62 | Exceptional 14.2% |
| Immigrants | Europe | 98.4 /100 | #63 | Exceptional 14.2% |
| Immigrants | Romania | 98.3 /100 | #64 | Exceptional 14.2% |
| Immigrants | Philippines | 98.2 /100 | #65 | Exceptional 14.3% |
| Slovenes | 98.1 /100 | #66 | Exceptional 14.3% |
| Europeans | 98.1 /100 | #67 | Exceptional 14.3% |
| Laotians | 98.0 /100 | #68 | Exceptional 14.3% |
| Immigrants | Bulgaria | 98.0 /100 | #69 | Exceptional 14.3% |
| Immigrants | Netherlands | 97.9 /100 | #70 | Exceptional 14.3% |
| Immigrants | Poland | 97.9 /100 | #71 | Exceptional 14.3% |
| Cambodians | 97.8 /100 | #72 | Exceptional 14.4% |
Demographics Similar to Immigrants from Northern Africa by Child Poverty Under the Age of 16
In terms of child poverty under the age of 16, the demographic groups most similar to Immigrants from Northern Africa are Colombian (15.8%, a difference of 0.060%), Yugoslavian (15.8%, a difference of 0.060%), Immigrants from Germany (15.8%, a difference of 0.10%), Guamanian/Chamorro (15.9%, a difference of 0.23%), and Immigrants from Oceania (15.9%, a difference of 0.37%).
| Demographics | Rating | Rank | Child Poverty Under the Age of 16 |
| Samoans | 77.3 /100 | #154 | Good 15.6% |
| Syrians | 76.1 /100 | #155 | Good 15.6% |
| Immigrants | Venezuela | 74.9 /100 | #156 | Good 15.7% |
| Immigrants | Nepal | 72.9 /100 | #157 | Good 15.7% |
| Immigrants | Chile | 72.8 /100 | #158 | Good 15.7% |
| Immigrants | Fiji | 71.1 /100 | #159 | Good 15.8% |
| Immigrants | Albania | 70.7 /100 | #160 | Good 15.8% |
| Immigrants | Northern Africa | 68.1 /100 | #161 | Good 15.8% |
| Colombians | 67.6 /100 | #162 | Good 15.8% |
| Yugoslavians | 67.6 /100 | #163 | Good 15.8% |
| Immigrants | Germany | 67.3 /100 | #164 | Good 15.8% |
| Guamanians/Chamorros | 66.4 /100 | #165 | Good 15.9% |
| Immigrants | Oceania | 65.4 /100 | #166 | Good 15.9% |
| Costa Ricans | 61.1 /100 | #167 | Good 16.0% |
| South Americans | 57.9 /100 | #168 | Average 16.0% |