Immigrants from Philippines vs Immigrants from Iran Single Father Poverty
COMPARE
Immigrants from Philippines
Immigrants from Iran
Single Father Poverty
Single Father Poverty Comparison
Immigrants from Philippines
Immigrants from Iran
14.0%
SINGLE FATHER POVERTY
100.0/ 100
METRIC RATING
13th/ 347
METRIC RANK
14.2%
SINGLE FATHER POVERTY
100.0/ 100
METRIC RATING
16th/ 347
METRIC RANK
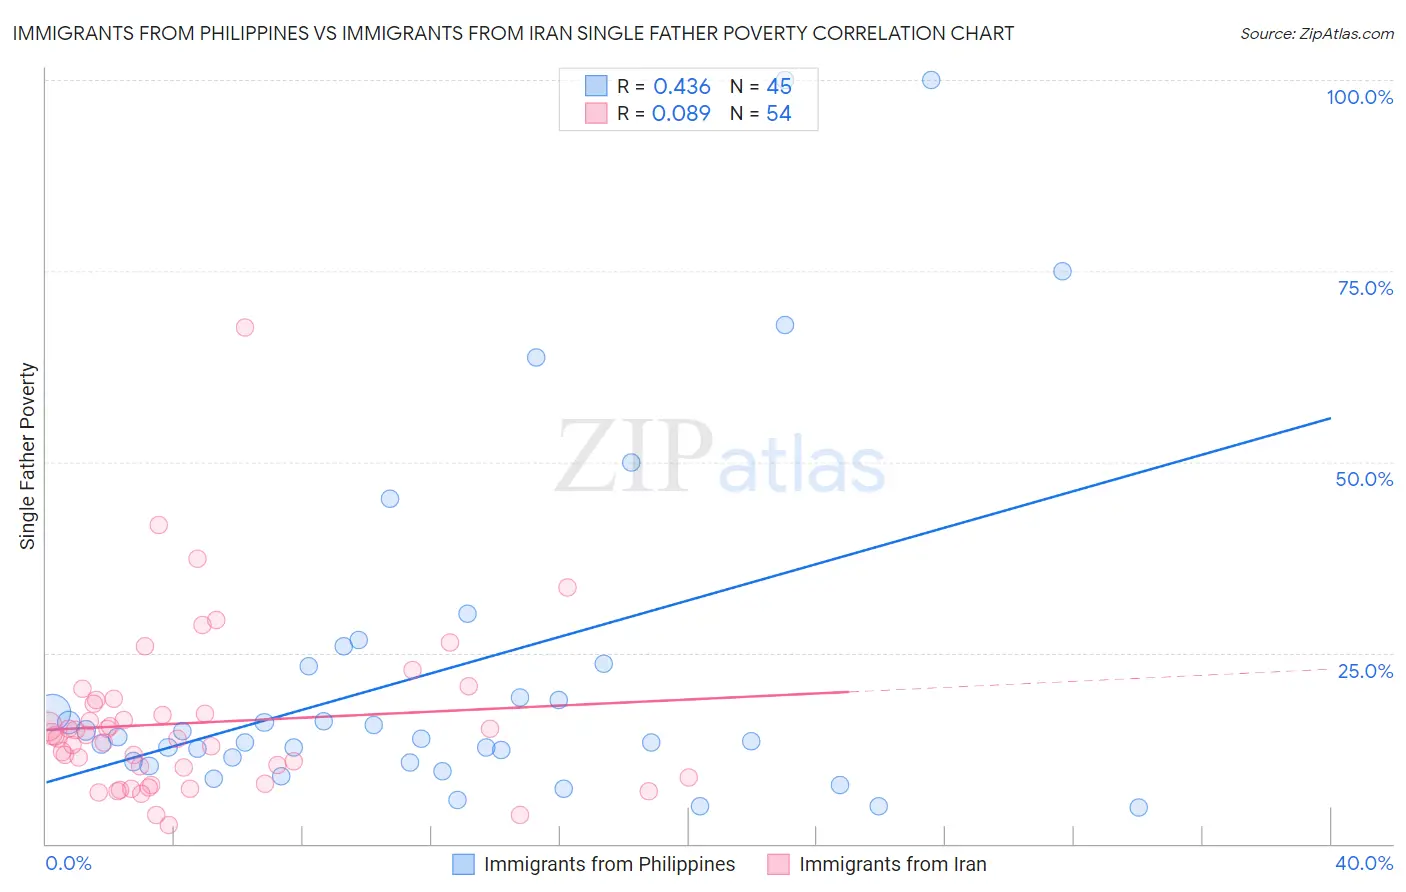
Immigrants from Philippines vs Immigrants from Iran Single Father Poverty Correlation Chart
The statistical analysis conducted on geographies consisting of 360,572,614 people shows a moderate positive correlation between the proportion of Immigrants from Philippines and poverty level among single fathers in the United States with a correlation coefficient (R) of 0.436 and weighted average of 14.0%. Similarly, the statistical analysis conducted on geographies consisting of 227,784,696 people shows a slight positive correlation between the proportion of Immigrants from Iran and poverty level among single fathers in the United States with a correlation coefficient (R) of 0.089 and weighted average of 14.2%, a difference of 0.96%.
Single Father Poverty Correlation Summary
| Measurement | Immigrants from Philippines | Immigrants from Iran |
| Minimum | 4.7% | 2.4% |
| Maximum | 100.0% | 67.6% |
| Range | 95.3% | 65.1% |
| Mean | 22.8% | 15.8% |
| Median | 13.8% | 14.0% |
| Interquartile 25% (IQ1) | 10.7% | 8.7% |
| Interquartile 75% (IQ3) | 23.4% | 18.3% |
| Interquartile Range (IQR) | 12.7% | 9.6% |
| Standard Deviation (Sample) | 23.4% | 10.9% |
| Standard Deviation (Population) | 23.1% | 10.8% |
Demographics Similar to Immigrants from Philippines and Immigrants from Iran by Single Father Poverty
In terms of single father poverty, the demographic groups most similar to Immigrants from Philippines are Filipino (14.0%, a difference of 0.15%), Immigrants from India (14.0%, a difference of 0.15%), Korean (14.0%, a difference of 0.55%), Afghan (14.0%, a difference of 0.66%), and Immigrants from Vietnam (14.1%, a difference of 0.70%). Similarly, the demographic groups most similar to Immigrants from Iran are Sri Lankan (14.2%, a difference of 0.20%), Immigrants from Vietnam (14.1%, a difference of 0.26%), Immigrants from Hong Kong (14.2%, a difference of 0.45%), Soviet Union (14.3%, a difference of 0.48%), and Immigrants from Iraq (14.3%, a difference of 0.52%).
| Demographics | Rating | Rank | Single Father Poverty |
| Immigrants | Fiji | 100.0 /100 | #4 | Exceptional 13.2% |
| Immigrants | Ethiopia | 100.0 /100 | #5 | Exceptional 13.4% |
| Ethiopians | 100.0 /100 | #6 | Exceptional 13.5% |
| Immigrants | Taiwan | 100.0 /100 | #7 | Exceptional 13.7% |
| Samoans | 100.0 /100 | #8 | Exceptional 13.8% |
| Afghans | 100.0 /100 | #9 | Exceptional 14.0% |
| Koreans | 100.0 /100 | #10 | Exceptional 14.0% |
| Filipinos | 100.0 /100 | #11 | Exceptional 14.0% |
| Immigrants | India | 100.0 /100 | #12 | Exceptional 14.0% |
| Immigrants | Philippines | 100.0 /100 | #13 | Exceptional 14.0% |
| Immigrants | Vietnam | 100.0 /100 | #14 | Exceptional 14.1% |
| Sri Lankans | 100.0 /100 | #15 | Exceptional 14.2% |
| Immigrants | Iran | 100.0 /100 | #16 | Exceptional 14.2% |
| Immigrants | Hong Kong | 100.0 /100 | #17 | Exceptional 14.2% |
| Soviet Union | 100.0 /100 | #18 | Exceptional 14.3% |
| Immigrants | Iraq | 100.0 /100 | #19 | Exceptional 14.3% |
| Immigrants | Singapore | 100.0 /100 | #20 | Exceptional 14.3% |
| Immigrants | Afghanistan | 100.0 /100 | #21 | Exceptional 14.3% |
| Taiwanese | 100.0 /100 | #22 | Exceptional 14.3% |
| Immigrants | Egypt | 100.0 /100 | #23 | Exceptional 14.4% |
| Immigrants | South Eastern Asia | 100.0 /100 | #24 | Exceptional 14.4% |