Immigrants from Peru vs Shoshone Receiving Food Stamps
COMPARE
Immigrants from Peru
Shoshone
Receiving Food Stamps
Receiving Food Stamps Comparison
Immigrants from Peru
Shoshone
12.0%
RECEIVING FOOD STAMPS
32.2/ 100
METRIC RATING
190th/ 347
METRIC RANK
12.4%
RECEIVING FOOD STAMPS
17.7/ 100
METRIC RATING
203rd/ 347
METRIC RANK
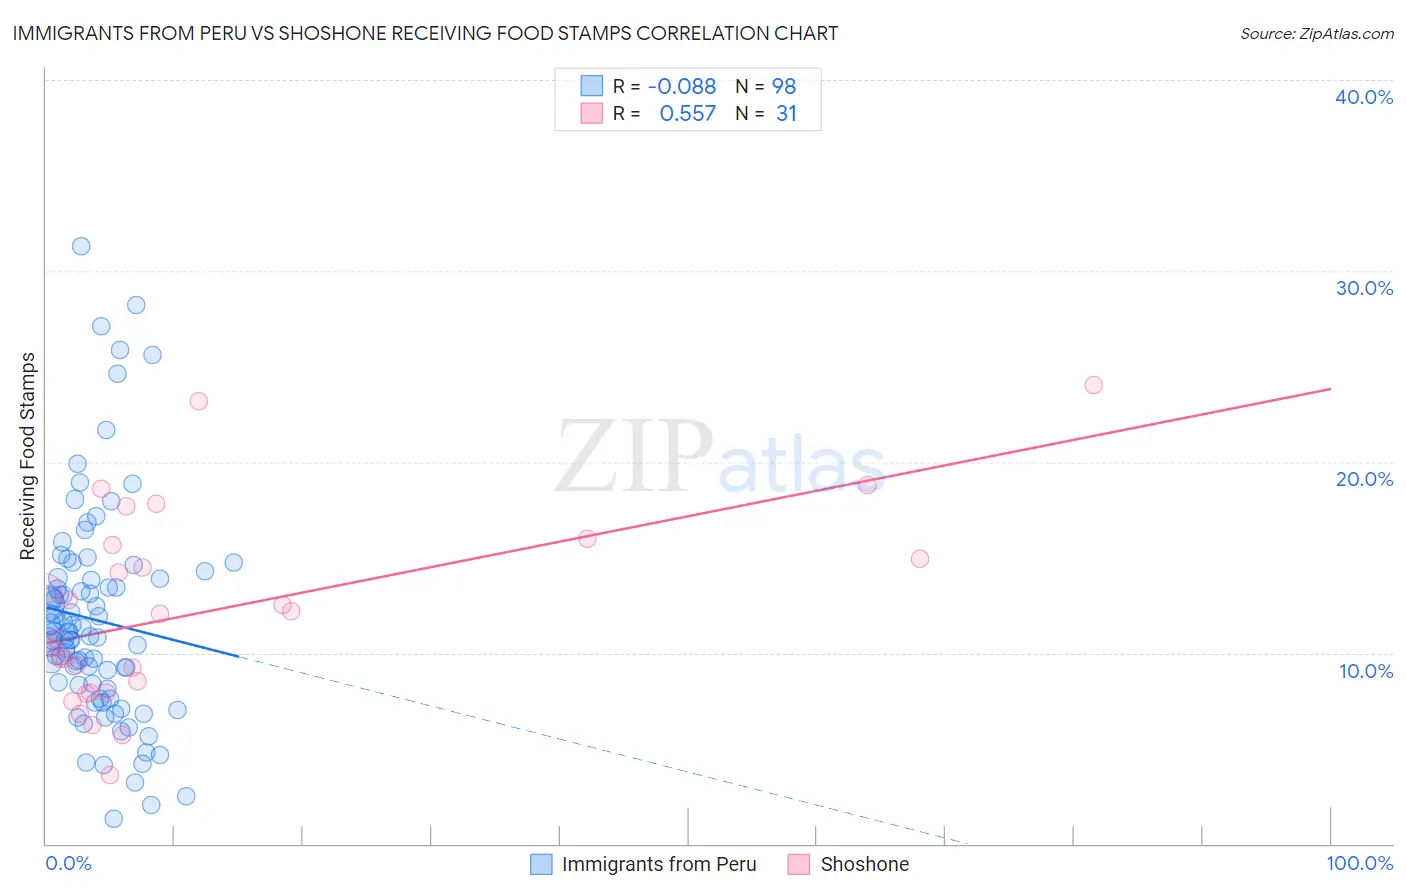
Immigrants from Peru vs Shoshone Receiving Food Stamps Correlation Chart
The statistical analysis conducted on geographies consisting of 328,237,841 people shows a slight negative correlation between the proportion of Immigrants from Peru and percentage of population receiving government assistance and/or food stamps in the United States with a correlation coefficient (R) of -0.088 and weighted average of 12.0%. Similarly, the statistical analysis conducted on geographies consisting of 66,597,434 people shows a substantial positive correlation between the proportion of Shoshone and percentage of population receiving government assistance and/or food stamps in the United States with a correlation coefficient (R) of 0.557 and weighted average of 12.4%, a difference of 2.7%.
Receiving Food Stamps Correlation Summary
| Measurement | Immigrants from Peru | Shoshone |
| Minimum | 1.3% | 3.6% |
| Maximum | 31.3% | 24.0% |
| Range | 30.0% | 20.4% |
| Mean | 11.7% | 12.2% |
| Median | 10.8% | 12.0% |
| Interquartile 25% (IQ1) | 8.3% | 7.9% |
| Interquartile 75% (IQ3) | 13.9% | 15.6% |
| Interquartile Range (IQR) | 5.6% | 7.7% |
| Standard Deviation (Sample) | 5.6% | 5.0% |
| Standard Deviation (Population) | 5.6% | 4.9% |
Demographics Similar to Immigrants from Peru and Shoshone by Receiving Food Stamps
In terms of receiving food stamps, the demographic groups most similar to Immigrants from Peru are Venezuelan (12.0%, a difference of 0.010%), Immigrants from Cameroon (12.0%, a difference of 0.060%), Samoan (12.1%, a difference of 0.19%), Sudanese (12.0%, a difference of 0.20%), and Albanian (12.0%, a difference of 0.50%). Similarly, the demographic groups most similar to Shoshone are Nonimmigrants (12.4%, a difference of 0.030%), Aleut (12.4%, a difference of 0.090%), Immigrants from Thailand (12.4%, a difference of 0.16%), Immigrants from Venezuela (12.3%, a difference of 0.53%), and Ugandan (12.2%, a difference of 1.0%).
| Demographics | Rating | Rank | Receiving Food Stamps |
| Spanish | 36.9 /100 | #186 | Fair 12.0% |
| Albanians | 35.4 /100 | #187 | Fair 12.0% |
| Sudanese | 33.4 /100 | #188 | Fair 12.0% |
| Immigrants | Cameroon | 32.5 /100 | #189 | Fair 12.0% |
| Immigrants | Peru | 32.2 /100 | #190 | Fair 12.0% |
| Venezuelans | 32.1 /100 | #191 | Fair 12.0% |
| Samoans | 31.0 /100 | #192 | Fair 12.1% |
| Immigrants | Fiji | 27.8 /100 | #193 | Fair 12.1% |
| Immigrants | Sudan | 27.1 /100 | #194 | Fair 12.1% |
| Americans | 26.7 /100 | #195 | Fair 12.2% |
| Iraqis | 26.6 /100 | #196 | Fair 12.2% |
| Delaware | 26.1 /100 | #197 | Fair 12.2% |
| Immigrants | Costa Rica | 25.4 /100 | #198 | Fair 12.2% |
| Portuguese | 25.1 /100 | #199 | Fair 12.2% |
| Sierra Leoneans | 23.6 /100 | #200 | Fair 12.2% |
| Ugandans | 22.5 /100 | #201 | Fair 12.2% |
| Immigrants | Venezuela | 20.1 /100 | #202 | Fair 12.3% |
| Shoshone | 17.7 /100 | #203 | Poor 12.4% |
| Immigrants | Nonimmigrants | 17.6 /100 | #204 | Poor 12.4% |
| Aleuts | 17.3 /100 | #205 | Poor 12.4% |
| Immigrants | Thailand | 17.0 /100 | #206 | Poor 12.4% |