Immigrants from Peru vs Cape Verdean Female Poverty Among 18-24 Year Olds
COMPARE
Immigrants from Peru
Cape Verdean
Female Poverty Among 18-24 Year Olds
Female Poverty Among 18-24 Year Olds Comparison
Immigrants from Peru
Cape Verdeans
16.9%
FEMALE POVERTY AMONG 18-24 YEAR OLDS
100.0/ 100
METRIC RATING
9th/ 347
METRIC RANK
19.4%
FEMALE POVERTY AMONG 18-24 YEAR OLDS
93.6/ 100
METRIC RATING
127th/ 347
METRIC RANK
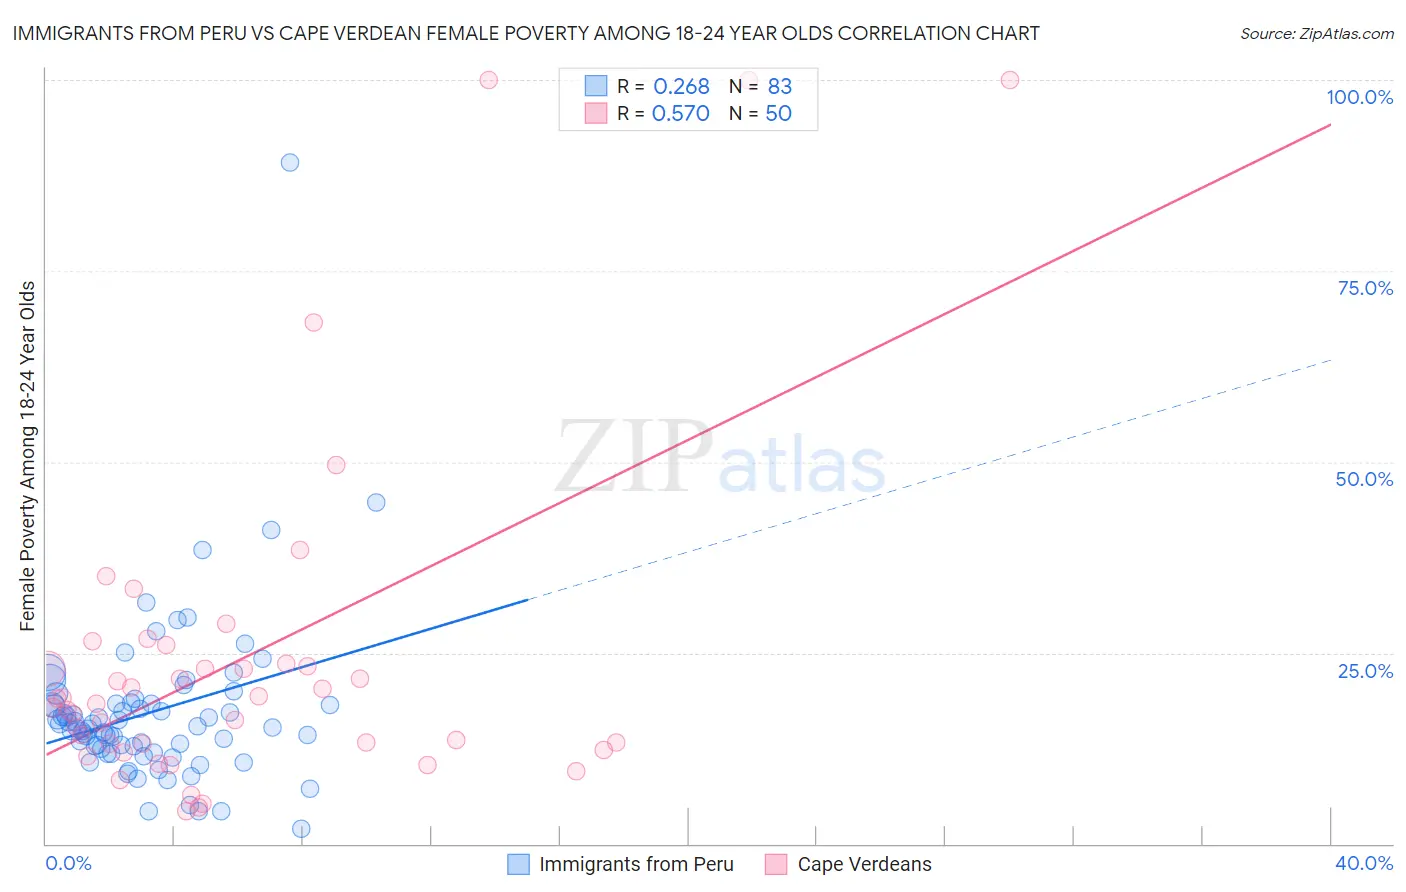
Immigrants from Peru vs Cape Verdean Female Poverty Among 18-24 Year Olds Correlation Chart
The statistical analysis conducted on geographies consisting of 322,984,963 people shows a weak positive correlation between the proportion of Immigrants from Peru and poverty level among females between the ages 18 and 24 in the United States with a correlation coefficient (R) of 0.268 and weighted average of 16.9%. Similarly, the statistical analysis conducted on geographies consisting of 106,282,002 people shows a substantial positive correlation between the proportion of Cape Verdeans and poverty level among females between the ages 18 and 24 in the United States with a correlation coefficient (R) of 0.570 and weighted average of 19.4%, a difference of 15.2%.
Female Poverty Among 18-24 Year Olds Correlation Summary
| Measurement | Immigrants from Peru | Cape Verdean |
| Minimum | 2.0% | 4.2% |
| Maximum | 89.2% | 100.0% |
| Range | 87.2% | 95.8% |
| Mean | 17.2% | 24.3% |
| Median | 15.3% | 18.6% |
| Interquartile 25% (IQ1) | 12.5% | 13.1% |
| Interquartile 75% (IQ3) | 18.4% | 23.6% |
| Interquartile Range (IQR) | 5.9% | 10.5% |
| Standard Deviation (Sample) | 10.9% | 22.3% |
| Standard Deviation (Population) | 10.9% | 22.1% |
Similar Demographics by Female Poverty Among 18-24 Year Olds
Demographics Similar to Immigrants from Peru by Female Poverty Among 18-24 Year Olds
In terms of female poverty among 18-24 year olds, the demographic groups most similar to Immigrants from Peru are Korean (16.9%, a difference of 0.36%), Thai (17.0%, a difference of 0.63%), Immigrants from Pakistan (17.0%, a difference of 0.72%), Immigrants from Bolivia (16.7%, a difference of 0.84%), and Immigrants from the Azores (16.7%, a difference of 1.1%).
| Demographics | Rating | Rank | Female Poverty Among 18-24 Year Olds |
| Chinese | 100.0 /100 | #2 | Exceptional 16.2% |
| Immigrants | Cuba | 100.0 /100 | #3 | Exceptional 16.4% |
| Immigrants | India | 100.0 /100 | #4 | Exceptional 16.4% |
| Immigrants | Portugal | 100.0 /100 | #5 | Exceptional 16.5% |
| Immigrants | Philippines | 100.0 /100 | #6 | Exceptional 16.7% |
| Immigrants | Azores | 100.0 /100 | #7 | Exceptional 16.7% |
| Immigrants | Bolivia | 100.0 /100 | #8 | Exceptional 16.7% |
| Immigrants | Peru | 100.0 /100 | #9 | Exceptional 16.9% |
| Koreans | 100.0 /100 | #10 | Exceptional 16.9% |
| Thais | 100.0 /100 | #11 | Exceptional 17.0% |
| Immigrants | Pakistan | 100.0 /100 | #12 | Exceptional 17.0% |
| Immigrants | Poland | 100.0 /100 | #13 | Exceptional 17.1% |
| Tongans | 100.0 /100 | #14 | Exceptional 17.1% |
| Cubans | 100.0 /100 | #15 | Exceptional 17.2% |
| Peruvians | 100.0 /100 | #16 | Exceptional 17.2% |
Demographics Similar to Cape Verdeans by Female Poverty Among 18-24 Year Olds
In terms of female poverty among 18-24 year olds, the demographic groups most similar to Cape Verdeans are Immigrants from Russia (19.4%, a difference of 0.020%), Immigrants from Panama (19.4%, a difference of 0.080%), Slovak (19.5%, a difference of 0.13%), Immigrants from England (19.5%, a difference of 0.14%), and Immigrants from Canada (19.5%, a difference of 0.14%).
| Demographics | Rating | Rank | Female Poverty Among 18-24 Year Olds |
| Immigrants | Northern Europe | 95.4 /100 | #120 | Exceptional 19.4% |
| Guyanese | 95.3 /100 | #121 | Exceptional 19.4% |
| Cambodians | 94.6 /100 | #122 | Exceptional 19.4% |
| Paraguayans | 94.6 /100 | #123 | Exceptional 19.4% |
| Immigrants | Chile | 94.3 /100 | #124 | Exceptional 19.4% |
| Immigrants | Panama | 94.0 /100 | #125 | Exceptional 19.4% |
| Immigrants | Russia | 93.7 /100 | #126 | Exceptional 19.4% |
| Cape Verdeans | 93.6 /100 | #127 | Exceptional 19.4% |
| Slovaks | 92.9 /100 | #128 | Exceptional 19.5% |
| Immigrants | England | 92.9 /100 | #129 | Exceptional 19.5% |
| Immigrants | Canada | 92.9 /100 | #130 | Exceptional 19.5% |
| Latvians | 92.7 /100 | #131 | Exceptional 19.5% |
| Jamaicans | 92.1 /100 | #132 | Exceptional 19.5% |
| Turks | 92.1 /100 | #133 | Exceptional 19.5% |
| Immigrants | North America | 92.1 /100 | #134 | Exceptional 19.5% |