Immigrants from Pakistan vs Immigrants from Lebanon Single Mother Poverty
COMPARE
Immigrants from Pakistan
Immigrants from Lebanon
Single Mother Poverty
Single Mother Poverty Comparison
Immigrants from Pakistan
Immigrants from Lebanon
26.0%
SINGLE MOTHER POVERTY
100.0/ 100
METRIC RATING
18th/ 347
METRIC RANK
28.6%
SINGLE MOTHER POVERTY
85.3/ 100
METRIC RATING
147th/ 347
METRIC RANK
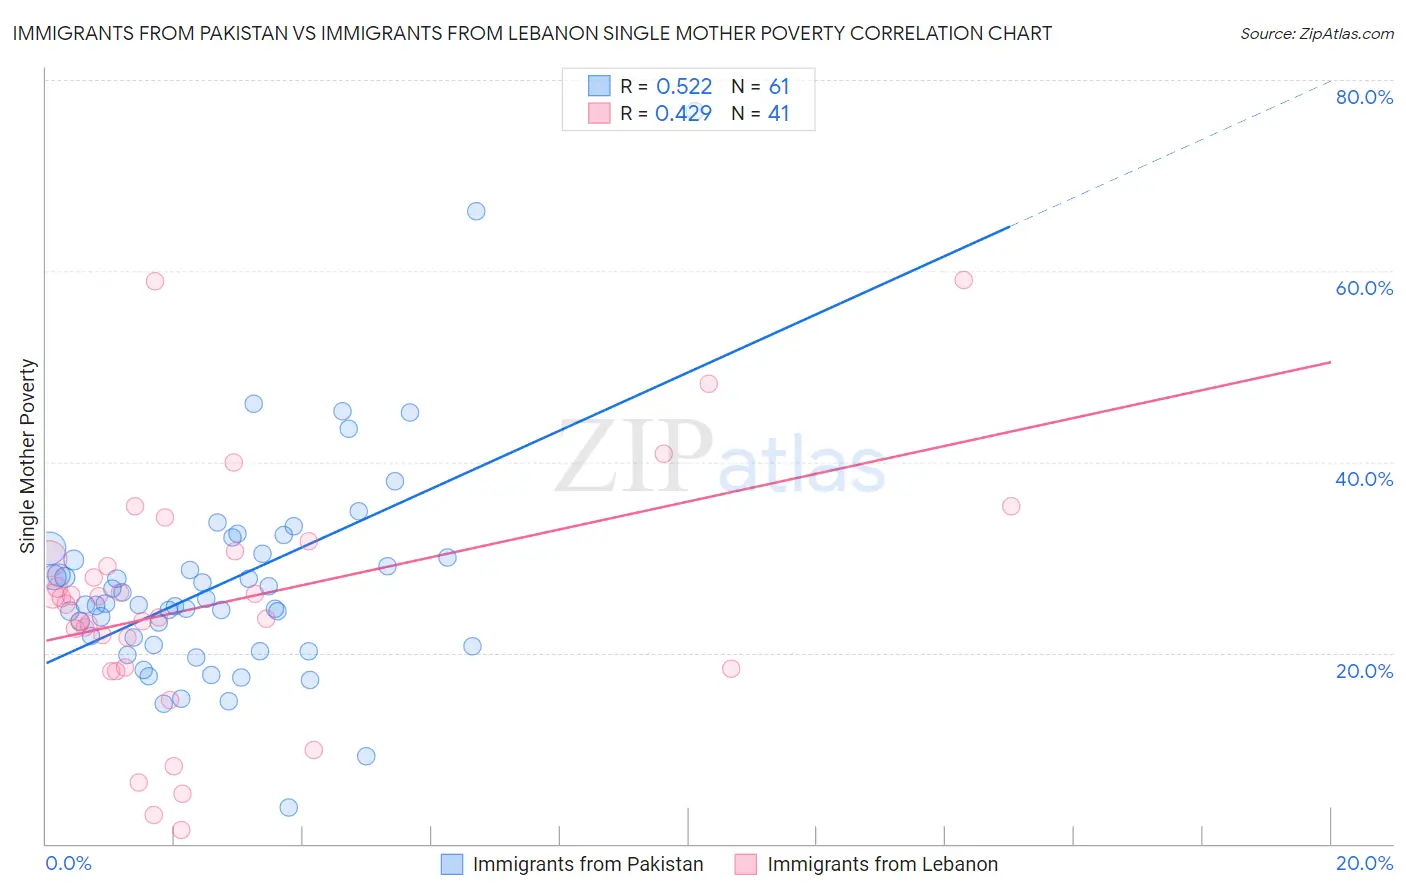
Immigrants from Pakistan vs Immigrants from Lebanon Single Mother Poverty Correlation Chart
The statistical analysis conducted on geographies consisting of 278,589,508 people shows a substantial positive correlation between the proportion of Immigrants from Pakistan and poverty level among single mothers in the United States with a correlation coefficient (R) of 0.522 and weighted average of 26.0%. Similarly, the statistical analysis conducted on geographies consisting of 213,301,083 people shows a moderate positive correlation between the proportion of Immigrants from Lebanon and poverty level among single mothers in the United States with a correlation coefficient (R) of 0.429 and weighted average of 28.6%, a difference of 9.7%.
Single Mother Poverty Correlation Summary
| Measurement | Immigrants from Pakistan | Immigrants from Lebanon |
| Minimum | 3.7% | 1.4% |
| Maximum | 76.8% | 59.0% |
| Range | 73.0% | 57.6% |
| Mean | 27.3% | 25.3% |
| Median | 25.0% | 25.1% |
| Interquartile 25% (IQ1) | 20.7% | 18.4% |
| Interquartile 75% (IQ3) | 30.2% | 30.2% |
| Interquartile Range (IQR) | 9.5% | 11.8% |
| Standard Deviation (Sample) | 11.5% | 12.6% |
| Standard Deviation (Population) | 11.4% | 12.5% |
Similar Demographics by Single Mother Poverty
Demographics Similar to Immigrants from Pakistan by Single Mother Poverty
In terms of single mother poverty, the demographic groups most similar to Immigrants from Pakistan are Immigrants from Eastern Asia (26.1%, a difference of 0.14%), Immigrants from China (26.1%, a difference of 0.27%), Asian (26.0%, a difference of 0.28%), Bolivian (25.9%, a difference of 0.46%), and Immigrants from Bolivia (26.2%, a difference of 0.46%).
| Demographics | Rating | Rank | Single Mother Poverty |
| Iranians | 100.0 /100 | #11 | Exceptional 25.5% |
| Bhutanese | 100.0 /100 | #12 | Exceptional 25.6% |
| Indians (Asian) | 100.0 /100 | #13 | Exceptional 25.8% |
| Immigrants | Singapore | 100.0 /100 | #14 | Exceptional 25.8% |
| Immigrants | Ireland | 100.0 /100 | #15 | Exceptional 25.8% |
| Bolivians | 100.0 /100 | #16 | Exceptional 25.9% |
| Asians | 100.0 /100 | #17 | Exceptional 26.0% |
| Immigrants | Pakistan | 100.0 /100 | #18 | Exceptional 26.0% |
| Immigrants | Eastern Asia | 100.0 /100 | #19 | Exceptional 26.1% |
| Immigrants | China | 100.0 /100 | #20 | Exceptional 26.1% |
| Immigrants | Bolivia | 100.0 /100 | #21 | Exceptional 26.2% |
| Immigrants | Korea | 100.0 /100 | #22 | Exceptional 26.2% |
| Burmese | 100.0 /100 | #23 | Exceptional 26.2% |
| Immigrants | Moldova | 100.0 /100 | #24 | Exceptional 26.2% |
| Immigrants | Asia | 100.0 /100 | #25 | Exceptional 26.3% |
Demographics Similar to Immigrants from Lebanon by Single Mother Poverty
In terms of single mother poverty, the demographic groups most similar to Immigrants from Lebanon are Syrian (28.6%, a difference of 0.010%), Serbian (28.6%, a difference of 0.030%), Immigrants from Denmark (28.5%, a difference of 0.070%), Immigrants from South America (28.5%, a difference of 0.080%), and Luxembourger (28.5%, a difference of 0.11%).
| Demographics | Rating | Rank | Single Mother Poverty |
| Immigrants | Colombia | 88.0 /100 | #140 | Excellent 28.5% |
| Danes | 87.1 /100 | #141 | Excellent 28.5% |
| South Africans | 86.6 /100 | #142 | Excellent 28.5% |
| Immigrants | North America | 86.5 /100 | #143 | Excellent 28.5% |
| Luxembourgers | 86.4 /100 | #144 | Excellent 28.5% |
| Immigrants | South America | 86.1 /100 | #145 | Excellent 28.5% |
| Immigrants | Denmark | 86.1 /100 | #146 | Excellent 28.5% |
| Immigrants | Lebanon | 85.3 /100 | #147 | Excellent 28.6% |
| Syrians | 85.3 /100 | #148 | Excellent 28.6% |
| Serbians | 85.0 /100 | #149 | Excellent 28.6% |
| Northern Europeans | 81.7 /100 | #150 | Excellent 28.6% |
| Immigrants | Oceania | 79.9 /100 | #151 | Good 28.7% |
| Austrians | 79.0 /100 | #152 | Good 28.7% |
| Slovenes | 76.4 /100 | #153 | Good 28.8% |
| Portuguese | 73.2 /100 | #154 | Good 28.8% |