Immigrants from Pakistan vs Eastern European Female Poverty
COMPARE
Immigrants from Pakistan
Eastern European
Female Poverty
Female Poverty Comparison
Immigrants from Pakistan
Eastern Europeans
11.8%
FEMALE POVERTY
99.4/ 100
METRIC RATING
36th/ 347
METRIC RANK
11.5%
FEMALE POVERTY
99.7/ 100
METRIC RATING
20th/ 347
METRIC RANK
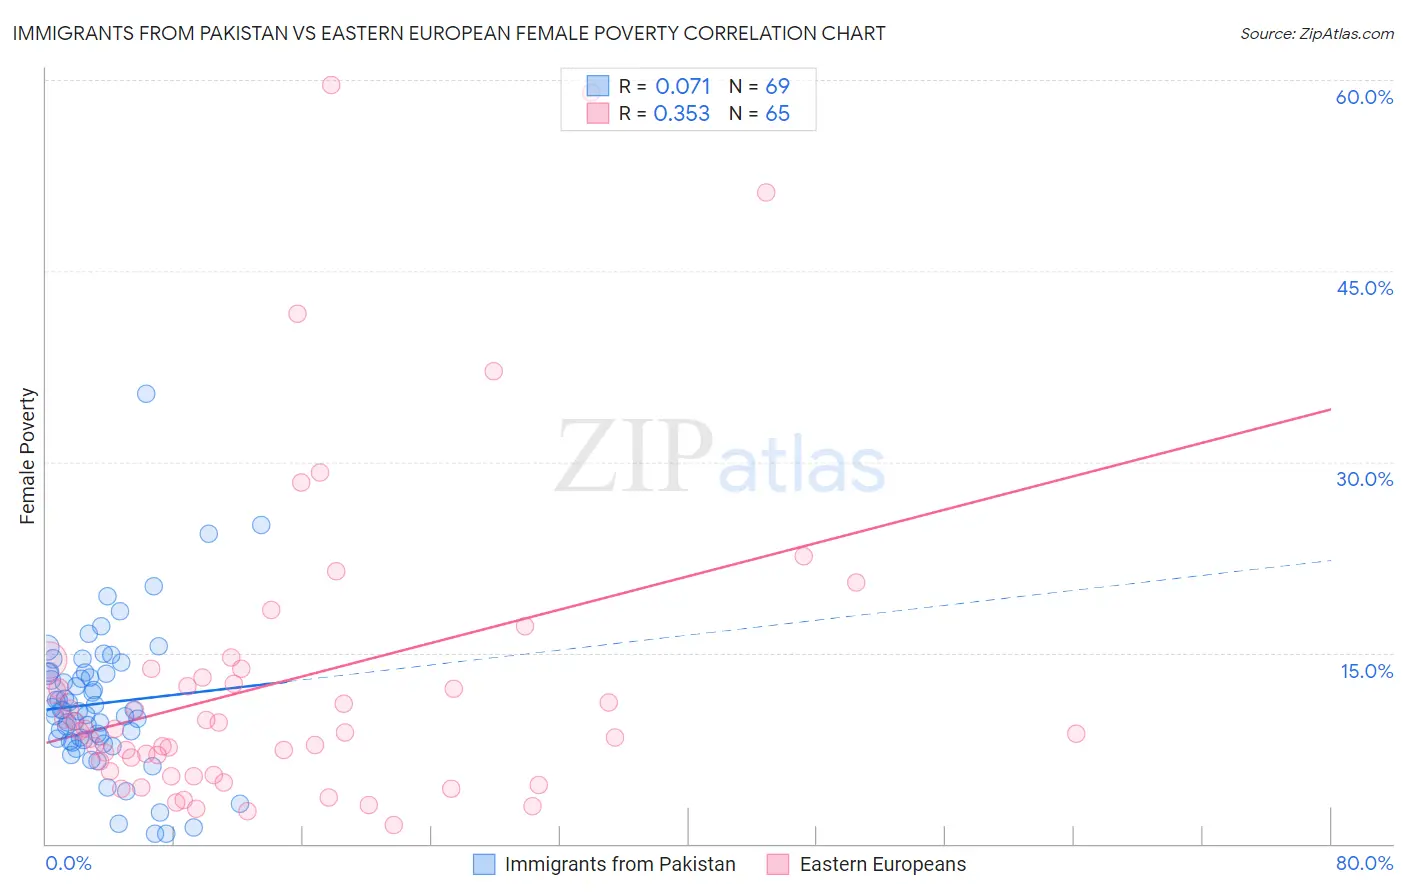
Immigrants from Pakistan vs Eastern European Female Poverty Correlation Chart
The statistical analysis conducted on geographies consisting of 283,777,836 people shows a slight positive correlation between the proportion of Immigrants from Pakistan and poverty level among females in the United States with a correlation coefficient (R) of 0.071 and weighted average of 11.8%. Similarly, the statistical analysis conducted on geographies consisting of 460,773,883 people shows a mild positive correlation between the proportion of Eastern Europeans and poverty level among females in the United States with a correlation coefficient (R) of 0.353 and weighted average of 11.5%, a difference of 2.4%.
Female Poverty Correlation Summary
| Measurement | Immigrants from Pakistan | Eastern European |
| Minimum | 0.75% | 1.4% |
| Maximum | 35.3% | 59.6% |
| Range | 34.6% | 58.2% |
| Mean | 11.0% | 12.7% |
| Median | 10.5% | 8.8% |
| Interquartile 25% (IQ1) | 8.1% | 5.5% |
| Interquartile 75% (IQ3) | 13.4% | 13.4% |
| Interquartile Range (IQR) | 5.3% | 7.9% |
| Standard Deviation (Sample) | 5.7% | 12.4% |
| Standard Deviation (Population) | 5.6% | 12.3% |
Demographics Similar to Immigrants from Pakistan and Eastern Europeans by Female Poverty
In terms of female poverty, the demographic groups most similar to Immigrants from Pakistan are Immigrants from Greece (11.8%, a difference of 0.10%), Russian (11.8%, a difference of 0.11%), Immigrants from Iran (11.8%, a difference of 0.17%), Immigrants from Singapore (11.8%, a difference of 0.34%), and Cypriot (11.8%, a difference of 0.45%). Similarly, the demographic groups most similar to Eastern Europeans are Norwegian (11.5%, a difference of 0.23%), Immigrants from Scotland (11.5%, a difference of 0.27%), Italian (11.6%, a difference of 0.50%), Swedish (11.6%, a difference of 0.53%), and Burmese (11.6%, a difference of 0.67%).
| Demographics | Rating | Rank | Female Poverty |
| Immigrants | Scotland | 99.8 /100 | #18 | Exceptional 11.5% |
| Norwegians | 99.8 /100 | #19 | Exceptional 11.5% |
| Eastern Europeans | 99.7 /100 | #20 | Exceptional 11.5% |
| Italians | 99.7 /100 | #21 | Exceptional 11.6% |
| Swedes | 99.7 /100 | #22 | Exceptional 11.6% |
| Burmese | 99.7 /100 | #23 | Exceptional 11.6% |
| Luxembourgers | 99.7 /100 | #24 | Exceptional 11.6% |
| Immigrants | Northern Europe | 99.6 /100 | #25 | Exceptional 11.6% |
| Croatians | 99.6 /100 | #26 | Exceptional 11.6% |
| Iranians | 99.6 /100 | #27 | Exceptional 11.7% |
| Immigrants | Korea | 99.6 /100 | #28 | Exceptional 11.7% |
| Immigrants | North Macedonia | 99.6 /100 | #29 | Exceptional 11.7% |
| Greeks | 99.5 /100 | #30 | Exceptional 11.7% |
| Poles | 99.5 /100 | #31 | Exceptional 11.7% |
| Danes | 99.5 /100 | #32 | Exceptional 11.7% |
| Cypriots | 99.5 /100 | #33 | Exceptional 11.8% |
| Immigrants | Singapore | 99.4 /100 | #34 | Exceptional 11.8% |
| Immigrants | Iran | 99.4 /100 | #35 | Exceptional 11.8% |
| Immigrants | Pakistan | 99.4 /100 | #36 | Exceptional 11.8% |
| Immigrants | Greece | 99.3 /100 | #37 | Exceptional 11.8% |
| Russians | 99.3 /100 | #38 | Exceptional 11.8% |