Immigrants from Oceania vs Vietnamese Single Mother Poverty
COMPARE
Immigrants from Oceania
Vietnamese
Single Mother Poverty
Single Mother Poverty Comparison
Immigrants from Oceania
Vietnamese
28.7%
SINGLE MOTHER POVERTY
79.9/ 100
METRIC RATING
151st/ 347
METRIC RANK
30.9%
SINGLE MOTHER POVERTY
0.7/ 100
METRIC RATING
250th/ 347
METRIC RANK
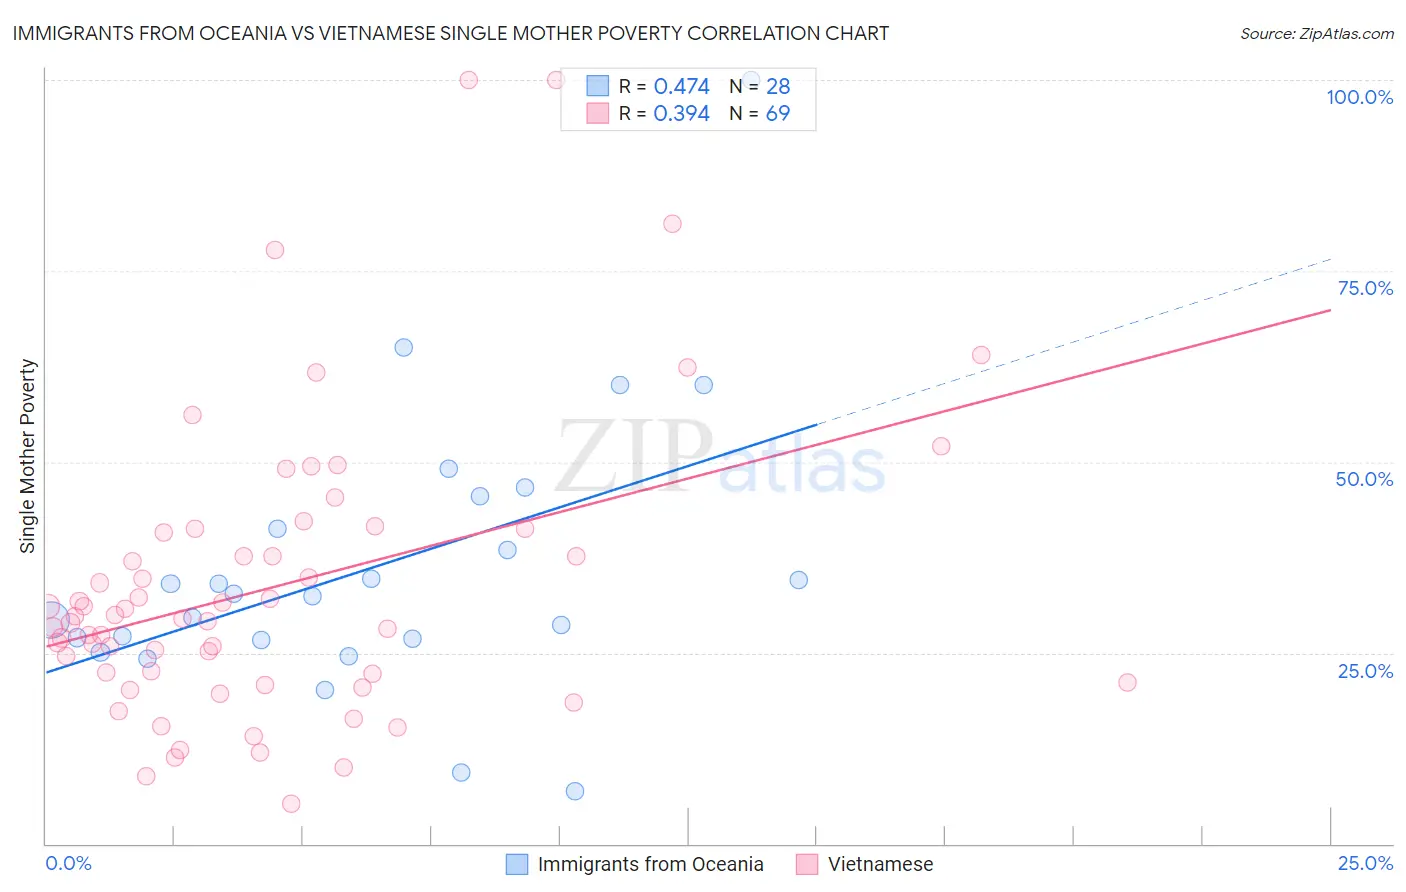
Immigrants from Oceania vs Vietnamese Single Mother Poverty Correlation Chart
The statistical analysis conducted on geographies consisting of 299,142,558 people shows a moderate positive correlation between the proportion of Immigrants from Oceania and poverty level among single mothers in the United States with a correlation coefficient (R) of 0.474 and weighted average of 28.7%. Similarly, the statistical analysis conducted on geographies consisting of 168,932,056 people shows a mild positive correlation between the proportion of Vietnamese and poverty level among single mothers in the United States with a correlation coefficient (R) of 0.394 and weighted average of 30.9%, a difference of 7.7%.
Single Mother Poverty Correlation Summary
| Measurement | Immigrants from Oceania | Vietnamese |
| Minimum | 6.9% | 5.3% |
| Maximum | 100.0% | 100.0% |
| Range | 93.1% | 94.7% |
| Mean | 36.2% | 33.6% |
| Median | 32.5% | 29.4% |
| Interquartile 25% (IQ1) | 26.7% | 21.7% |
| Interquartile 75% (IQ3) | 43.3% | 41.0% |
| Interquartile Range (IQR) | 16.6% | 19.2% |
| Standard Deviation (Sample) | 18.5% | 19.1% |
| Standard Deviation (Population) | 18.1% | 19.0% |
Similar Demographics by Single Mother Poverty
Demographics Similar to Immigrants from Oceania by Single Mother Poverty
In terms of single mother poverty, the demographic groups most similar to Immigrants from Oceania are Austrian (28.7%, a difference of 0.070%), Northern European (28.6%, a difference of 0.14%), Slovene (28.8%, a difference of 0.25%), Serbian (28.6%, a difference of 0.44%), and Immigrants from Lebanon (28.6%, a difference of 0.46%).
| Demographics | Rating | Rank | Single Mother Poverty |
| Luxembourgers | 86.4 /100 | #144 | Excellent 28.5% |
| Immigrants | South America | 86.1 /100 | #145 | Excellent 28.5% |
| Immigrants | Denmark | 86.1 /100 | #146 | Excellent 28.5% |
| Immigrants | Lebanon | 85.3 /100 | #147 | Excellent 28.6% |
| Syrians | 85.3 /100 | #148 | Excellent 28.6% |
| Serbians | 85.0 /100 | #149 | Excellent 28.6% |
| Northern Europeans | 81.7 /100 | #150 | Excellent 28.6% |
| Immigrants | Oceania | 79.9 /100 | #151 | Good 28.7% |
| Austrians | 79.0 /100 | #152 | Good 28.7% |
| Slovenes | 76.4 /100 | #153 | Good 28.8% |
| Portuguese | 73.2 /100 | #154 | Good 28.8% |
| Ugandans | 71.7 /100 | #155 | Good 28.8% |
| Iraqis | 71.5 /100 | #156 | Good 28.8% |
| Immigrants | Western Europe | 71.1 /100 | #157 | Good 28.9% |
| Immigrants | Hungary | 70.6 /100 | #158 | Good 28.9% |
Demographics Similar to Vietnamese by Single Mother Poverty
In terms of single mother poverty, the demographic groups most similar to Vietnamese are Tlingit-Haida (30.9%, a difference of 0.12%), Alaska Native (30.9%, a difference of 0.13%), Cape Verdean (30.8%, a difference of 0.15%), Celtic (30.9%, a difference of 0.16%), and French Canadian (30.8%, a difference of 0.22%).
| Demographics | Rating | Rank | Single Mother Poverty |
| Bermudans | 1.6 /100 | #243 | Tragic 30.6% |
| French | 1.3 /100 | #244 | Tragic 30.7% |
| Barbadians | 1.3 /100 | #245 | Tragic 30.7% |
| Ecuadorians | 0.9 /100 | #246 | Tragic 30.8% |
| West Indians | 0.9 /100 | #247 | Tragic 30.8% |
| French Canadians | 0.9 /100 | #248 | Tragic 30.8% |
| Cape Verdeans | 0.8 /100 | #249 | Tragic 30.8% |
| Vietnamese | 0.7 /100 | #250 | Tragic 30.9% |
| Tlingit-Haida | 0.6 /100 | #251 | Tragic 30.9% |
| Alaska Natives | 0.6 /100 | #252 | Tragic 30.9% |
| Celtics | 0.6 /100 | #253 | Tragic 30.9% |
| Senegalese | 0.5 /100 | #254 | Tragic 31.0% |
| Belizeans | 0.5 /100 | #255 | Tragic 31.0% |
| Immigrants | West Indies | 0.4 /100 | #256 | Tragic 31.1% |
| Immigrants | Bahamas | 0.4 /100 | #257 | Tragic 31.1% |