Immigrants from Norway vs Alsatian Single Male Poverty
COMPARE
Immigrants from Norway
Alsatian
Single Male Poverty
Single Male Poverty Comparison
Immigrants from Norway
Alsatians
13.0%
SINGLE MALE POVERTY
21.8/ 100
METRIC RATING
199th/ 347
METRIC RANK
15.2%
SINGLE MALE POVERTY
0.0/ 100
METRIC RATING
302nd/ 347
METRIC RANK
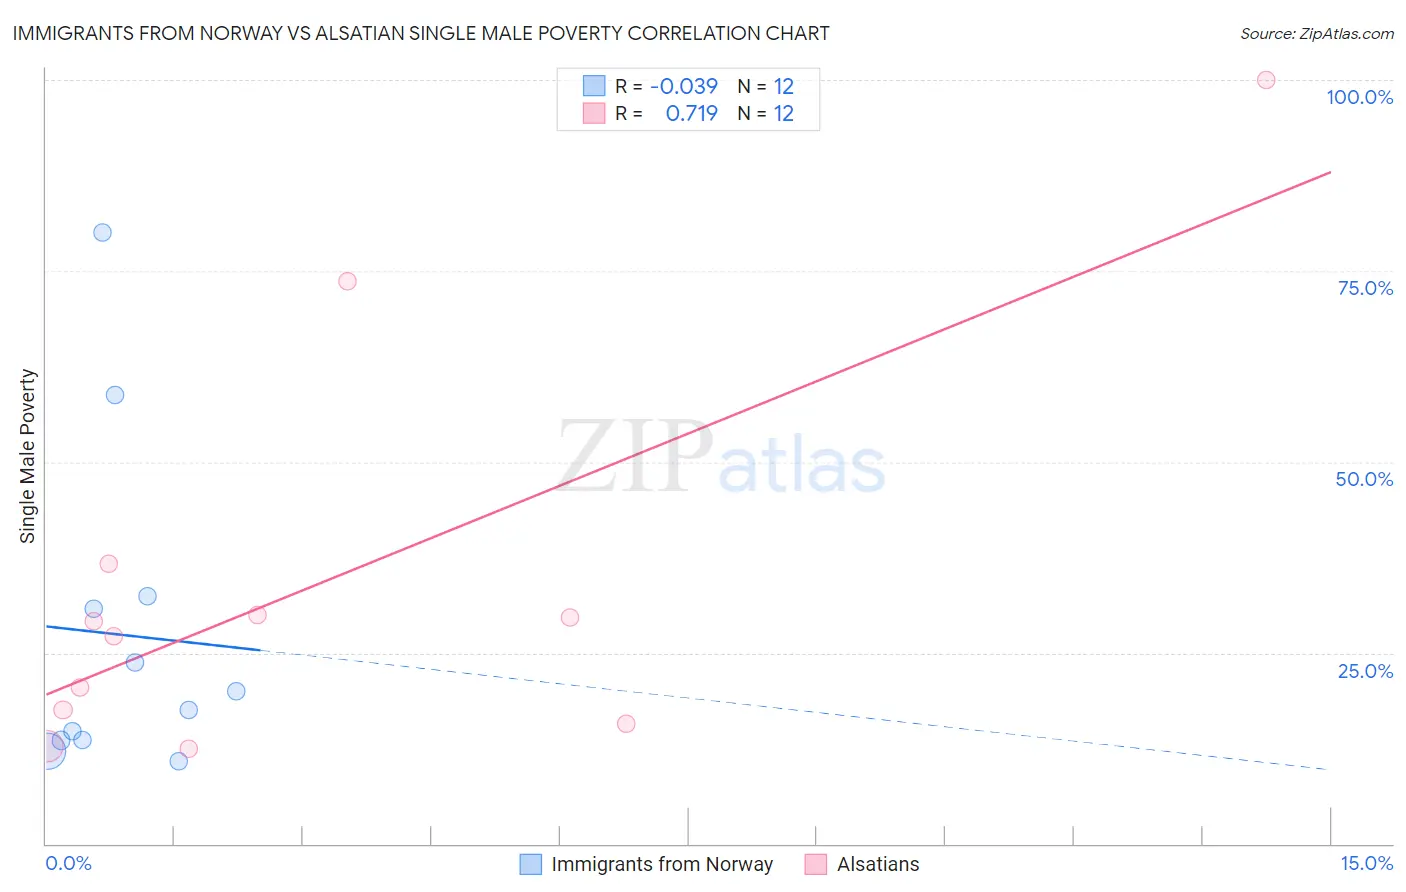
Immigrants from Norway vs Alsatian Single Male Poverty Correlation Chart
The statistical analysis conducted on geographies consisting of 108,569,706 people shows no correlation between the proportion of Immigrants from Norway and poverty level among single males in the United States with a correlation coefficient (R) of -0.039 and weighted average of 13.0%. Similarly, the statistical analysis conducted on geographies consisting of 78,244,917 people shows a strong positive correlation between the proportion of Alsatians and poverty level among single males in the United States with a correlation coefficient (R) of 0.719 and weighted average of 15.2%, a difference of 17.1%.
Single Male Poverty Correlation Summary
| Measurement | Immigrants from Norway | Alsatian |
| Minimum | 10.8% | 12.5% |
| Maximum | 80.0% | 100.0% |
| Range | 69.2% | 87.5% |
| Mean | 27.4% | 33.8% |
| Median | 18.8% | 28.1% |
| Interquartile 25% (IQ1) | 13.5% | 16.6% |
| Interquartile 75% (IQ3) | 31.6% | 33.3% |
| Interquartile Range (IQR) | 18.1% | 16.7% |
| Standard Deviation (Sample) | 21.3% | 26.5% |
| Standard Deviation (Population) | 20.4% | 25.4% |
Similar Demographics by Single Male Poverty
Demographics Similar to Immigrants from Norway by Single Male Poverty
In terms of single male poverty, the demographic groups most similar to Immigrants from Norway are Lithuanian (13.0%, a difference of 0.020%), Slovene (13.0%, a difference of 0.020%), Trinidadian and Tobagonian (13.0%, a difference of 0.030%), Basque (13.0%, a difference of 0.090%), and Immigrants from Grenada (13.0%, a difference of 0.10%).
| Demographics | Rating | Rank | Single Male Poverty |
| Immigrants | Jamaica | 26.5 /100 | #192 | Fair 13.0% |
| Immigrants | South Africa | 26.1 /100 | #193 | Fair 13.0% |
| Liberians | 25.2 /100 | #194 | Fair 13.0% |
| Immigrants | England | 23.4 /100 | #195 | Fair 13.0% |
| Immigrants | Grenada | 23.1 /100 | #196 | Fair 13.0% |
| Immigrants | Laos | 23.1 /100 | #197 | Fair 13.0% |
| Lithuanians | 22.1 /100 | #198 | Fair 13.0% |
| Immigrants | Norway | 21.8 /100 | #199 | Fair 13.0% |
| Slovenes | 21.6 /100 | #200 | Fair 13.0% |
| Trinidadians and Tobagonians | 21.4 /100 | #201 | Fair 13.0% |
| Basques | 20.7 /100 | #202 | Fair 13.0% |
| Immigrants | Bangladesh | 20.4 /100 | #203 | Fair 13.0% |
| Estonians | 20.3 /100 | #204 | Fair 13.0% |
| Poles | 19.3 /100 | #205 | Poor 13.0% |
| Northern Europeans | 18.9 /100 | #206 | Poor 13.0% |
Demographics Similar to Alsatians by Single Male Poverty
In terms of single male poverty, the demographic groups most similar to Alsatians are Dominican (15.2%, a difference of 0.16%), Cree (15.1%, a difference of 0.98%), Aleut (15.4%, a difference of 1.0%), Alaska Native (15.4%, a difference of 1.1%), and Delaware (15.0%, a difference of 1.4%).
| Demographics | Rating | Rank | Single Male Poverty |
| Scotch-Irish | 0.0 /100 | #295 | Tragic 14.7% |
| Africans | 0.0 /100 | #296 | Tragic 14.7% |
| Immigrants | Dominican Republic | 0.0 /100 | #297 | Tragic 14.8% |
| French American Indians | 0.0 /100 | #298 | Tragic 15.0% |
| Delaware | 0.0 /100 | #299 | Tragic 15.0% |
| Cree | 0.0 /100 | #300 | Tragic 15.1% |
| Dominicans | 0.0 /100 | #301 | Tragic 15.2% |
| Alsatians | 0.0 /100 | #302 | Tragic 15.2% |
| Aleuts | 0.0 /100 | #303 | Tragic 15.4% |
| Alaska Natives | 0.0 /100 | #304 | Tragic 15.4% |
| Blackfeet | 0.0 /100 | #305 | Tragic 15.5% |
| Pennsylvania Germans | 0.0 /100 | #306 | Tragic 15.6% |
| Ute | 0.0 /100 | #307 | Tragic 15.7% |
| Potawatomi | 0.0 /100 | #308 | Tragic 15.8% |
| Americans | 0.0 /100 | #309 | Tragic 15.8% |