Immigrants from North Macedonia vs Immigrants from Jamaica Poverty

COMPARE

Immigrants from North Macedonia
Race
Ancestry
AfghanAfricanAlaska NativeAlaskan AthabascanAlbanianAleutAlsatianAmericanApacheArabArapahoArgentineanArmenianAssyrian/Chaldean/SyriacAustralianAustrianBahamianBangladeshiBarbadianBasqueBelgianBelizeanBermudanBhutaneseBlackfeetBolivianBrazilianBritishBritish West IndianBulgarianBurmeseCajunCambodianCanadianCape VerdeanCarpatho RusynCelticCentral AmericanCentral American IndianCherokeeCheyenneChickasawChileanChineseChippewaChoctawColombianColvilleComancheCosta RicanCreeCreekCroatianCrowCubanCypriotCzechCzechoslovakianDanishDelawareDominicanDutchDutch West IndianEastern EuropeanEcuadorianEgyptianEnglishEstonianEthiopianEuropeanFijianFilipinoFinnishFrenchFrench American IndianFrench CanadianGermanGerman RussianGhanaianGreekGuamanian/ChamorroGuatemalanGuyaneseHaitianHmongHonduranHopiHoumaHungarianIcelanderIndian (Asian)IndonesianInupiatIranianIraqiIrishIroquoisIsraeliItalianJamaicanJapaneseJordanianKenyanKiowaKoreanLaotianLatvianLebaneseLiberianLithuanianLumbeeLuxembourgerMacedonianMalaysianMalteseMarshalleseMenomineeMexicanMexican American IndianMongolianMoroccanNative HawaiianNavajoNepaleseNew ZealanderNicaraguanNigerianNorthern EuropeanNorwegianOkinawanOsageOttawaPaiutePakistaniPalestinianPanamanianParaguayanPennsylvania GermanPeruvianPimaPolishPortuguesePotawatomiPuebloPuerto RicanPuget Sound SalishRomanianRussianSalvadoranSamoanScandinavianScotch-IrishScottishSeminoleSenegaleseSerbianShoshoneSierra LeoneanSiouxSlavicSlovakSloveneSomaliSouth AfricanSouth AmericanSouth American IndianSoviet UnionSpaniardSpanishSpanish AmericanSpanish American IndianSri LankanSubsaharan AfricanSudaneseSwedishSwissSyrianTaiwaneseThaiTlingit-HaidaTohono O'OdhamTonganTrinidadian and TobagonianTsimshianTurkishU.S. Virgin IslanderUgandanUkrainianUruguayanUteVenezuelanVietnameseWelshWest IndianYakamaYaquiYugoslavianYumanYup'ikZimbabwean
Immigration
NonimmigrantsImmigrantsAfghanistanAfricaAlbaniaArgentinaArmeniaAsiaAustraliaAustriaBahamasBangladeshBarbadosBelarusBelgiumBelizeBoliviaBosnia and HerzegovinaBrazilBulgariaBurma/MyanmarCabo VerdeCambodiaCameroonCanadaCaribbeanCentral AmericaChileChinaColombiaCongoCosta RicaCroatiaCubaCzechoslovakiaDenmarkDominicaDominican RepublicEastern AfricaEastern AsiaEastern EuropeEcuadorEgyptEl SalvadorEnglandEritreaEthiopiaEuropeFijiFranceGermanyGhanaGreeceGrenadaGuatemalaGuyanaHaitiHondurasHong KongHungaryIndiaIndonesiaIranIraqIrelandIsraelItalyJapanJordanKazakhstanKenyaKoreaKuwaitLaosLatin AmericaLatviaLebanonLiberiaLithuaniaMalaysiaMexicoMicronesiaMiddle AfricaMoldovaMoroccoNepalNetherlandsNicaraguaNigeriaNorth AmericaNorth MacedoniaNorthern AfricaNorthern EuropeNorwayOceaniaPakistanPanamaPeruPhilippinesPolandPortugalRomaniaRussiaSaudi ArabiaScotlandSenegalSerbiaSierra LeoneSingaporeSomaliaSouth AfricaSouth AmericaSouth Central AsiaSouth Eastern AsiaSouthern EuropeSpainSri LankaSt. Vincent and the GrenadinesSudanSwedenSwitzerlandSyriaTaiwanThailandTrinidad and TobagoTurkeyUgandaUkraineUruguayUzbekistanVenezuelaVietnamWest IndiesWestern AfricaWestern AsiaWestern EuropeYemenZaireZimbabweAzores
Immigrants from Jamaica
Race
Ancestry
AfghanAfricanAlaska NativeAlaskan AthabascanAlbanianAleutAlsatianAmericanApacheArabArapahoArgentineanArmenianAssyrian/Chaldean/SyriacAustralianAustrianBahamianBangladeshiBarbadianBasqueBelgianBelizeanBermudanBhutaneseBlackfeetBolivianBrazilianBritishBritish West IndianBulgarianBurmeseCajunCambodianCanadianCape VerdeanCarpatho RusynCelticCentral AmericanCentral American IndianCherokeeCheyenneChickasawChileanChineseChippewaChoctawColombianColvilleComancheCosta RicanCreeCreekCroatianCrowCubanCypriotCzechCzechoslovakianDanishDelawareDominicanDutchDutch West IndianEastern EuropeanEcuadorianEgyptianEnglishEstonianEthiopianEuropeanFijianFilipinoFinnishFrenchFrench American IndianFrench CanadianGermanGerman RussianGhanaianGreekGuamanian/ChamorroGuatemalanGuyaneseHaitianHmongHonduranHopiHoumaHungarianIcelanderIndian (Asian)IndonesianInupiatIranianIraqiIrishIroquoisIsraeliItalianJamaicanJapaneseJordanianKenyanKiowaKoreanLaotianLatvianLebaneseLiberianLithuanianLumbeeLuxembourgerMacedonianMalaysianMalteseMarshalleseMenomineeMexicanMexican American IndianMongolianMoroccanNative HawaiianNavajoNepaleseNew ZealanderNicaraguanNigerianNorthern EuropeanNorwegianOkinawanOsageOttawaPaiutePakistaniPalestinianPanamanianParaguayanPennsylvania GermanPeruvianPimaPolishPortuguesePotawatomiPuebloPuerto RicanPuget Sound SalishRomanianRussianSalvadoranSamoanScandinavianScotch-IrishScottishSeminoleSenegaleseSerbianShoshoneSierra LeoneanSiouxSlavicSlovakSloveneSomaliSouth AfricanSouth AmericanSouth American IndianSoviet UnionSpaniardSpanishSpanish AmericanSpanish American IndianSri LankanSubsaharan AfricanSudaneseSwedishSwissSyrianTaiwaneseThaiTlingit-HaidaTohono O'OdhamTonganTrinidadian and TobagonianTsimshianTurkishU.S. Virgin IslanderUgandanUkrainianUruguayanUteVenezuelanVietnameseWelshWest IndianYakamaYaquiYugoslavianYumanYup'ikZimbabwean
Immigration
NonimmigrantsImmigrantsAfghanistanAfricaAlbaniaArgentinaArmeniaAsiaAustraliaAustriaBahamasBangladeshBarbadosBelarusBelgiumBelizeBoliviaBosnia and HerzegovinaBrazilBulgariaBurma/MyanmarCabo VerdeCambodiaCameroonCanadaCaribbeanCentral AmericaChileChinaColombiaCongoCosta RicaCroatiaCubaCzechoslovakiaDenmarkDominicaDominican RepublicEastern AfricaEastern AsiaEastern EuropeEcuadorEgyptEl SalvadorEnglandEritreaEthiopiaEuropeFijiFranceGermanyGhanaGreeceGrenadaGuatemalaGuyanaHaitiHondurasHong KongHungaryIndiaIndonesiaIranIraqIrelandIsraelItalyJamaicaJapanJordanKazakhstanKenyaKoreaKuwaitLaosLatin AmericaLatviaLebanonLiberiaLithuaniaMalaysiaMexicoMicronesiaMiddle AfricaMoldovaMoroccoNepalNetherlandsNicaraguaNigeriaNorth AmericaNorthern AfricaNorthern EuropeNorwayOceaniaPakistanPanamaPeruPhilippinesPolandPortugalRomaniaRussiaSaudi ArabiaScotlandSenegalSerbiaSierra LeoneSingaporeSomaliaSouth AfricaSouth AmericaSouth Central AsiaSouth Eastern AsiaSouthern EuropeSpainSri LankaSt. Vincent and the GrenadinesSudanSwedenSwitzerlandSyriaTaiwanThailandTrinidad and TobagoTurkeyUgandaUkraineUruguayUzbekistanVenezuelaVietnamWest IndiesWestern AfricaWestern AsiaWestern EuropeYemenZaireZimbabweAzores
Poverty
Income
Poverty
Unemployment
Labor Participation
Family Structure
Vehicle Availability
Education Level
Disability

Poverty Comparison

Immigrants from North Macedonia

Immigrants from Jamaica

Exceptional
Tragic
10.6%
POVERTY
99.7/ 100
METRIC RATING
20th/ 347
METRIC RANK
14.4%
POVERTY
0.1/ 100
METRIC RATING
264th/ 347
METRIC RANK

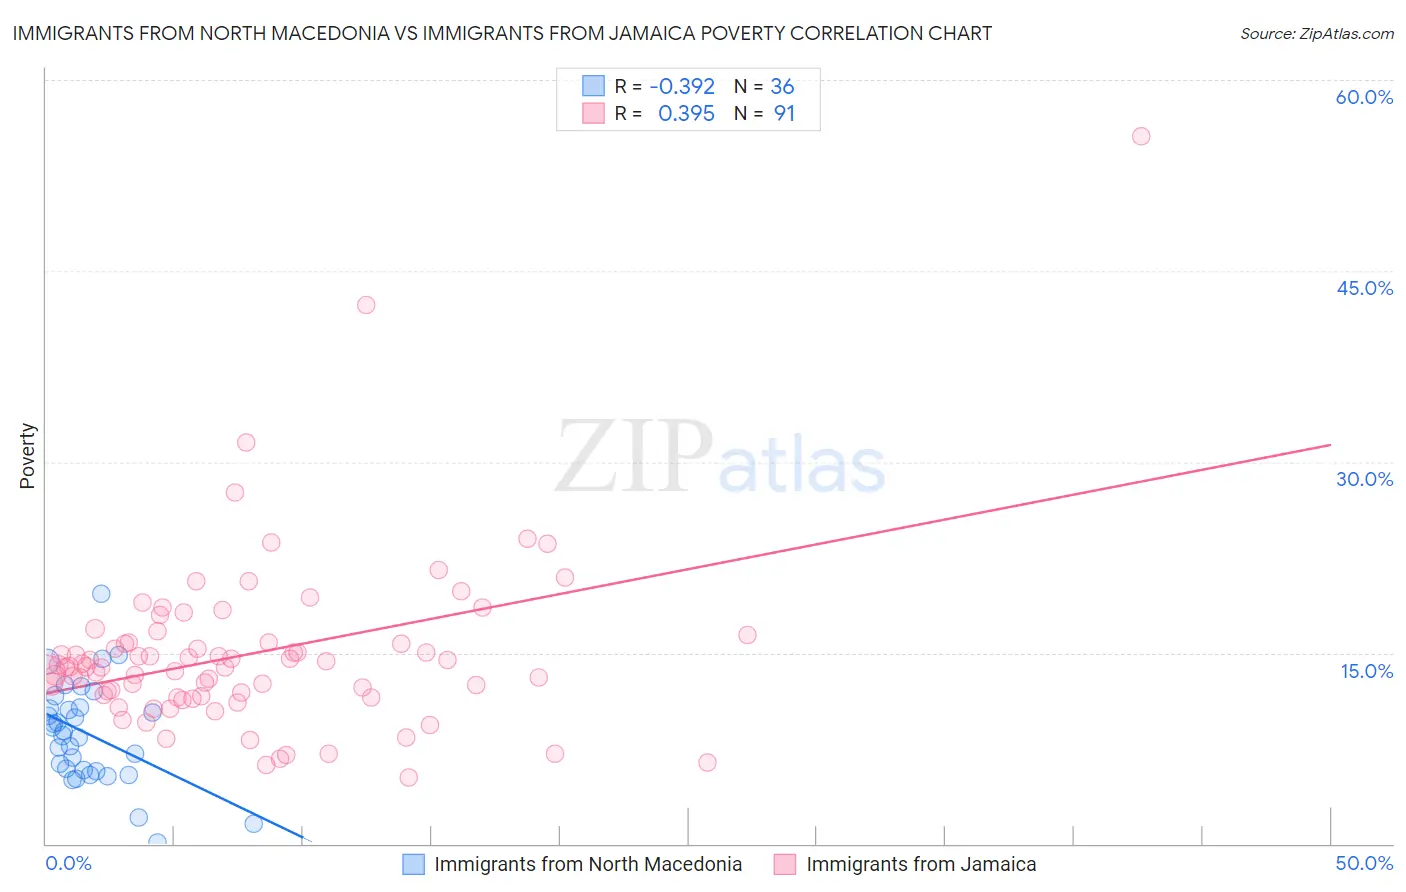
Immigrants from North Macedonia vs Immigrants from Jamaica Poverty Correlation Chart

The statistical analysis conducted on geographies consisting of 74,289,805 people shows a mild negative correlation between the proportion of Immigrants from North Macedonia and poverty level in the United States with a correlation coefficient (R) of -0.392 and weighted average of 10.6%. Similarly, the statistical analysis conducted on geographies consisting of 301,608,738 people shows a mild positive correlation between the proportion of Immigrants from Jamaica and poverty level in the United States with a correlation coefficient (R) of 0.395 and weighted average of 14.4%, a difference of 36.6%.
Immigrants from North Macedonia vs Immigrants from Jamaica Poverty

Poverty Correlation Summary

MeasurementImmigrants from North MacedoniaImmigrants from Jamaica
Minimum0.071%5.2%
Maximum19.6%55.6%
Range19.5%50.4%
Mean8.6%14.9%
Median8.7%13.9%
Interquartile 25% (IQ1)5.8%11.6%
Interquartile 75% (IQ3)10.7%15.8%
Interquartile Range (IQR)4.9%4.3%
Standard Deviation (Sample)4.0%6.9%
Standard Deviation (Population)3.9%6.9%

Similar Demographics by Poverty

Demographics Similar to Immigrants from North Macedonia by Poverty

In terms of poverty, the demographic groups most similar to Immigrants from North Macedonia are Luxembourger (10.6%, a difference of 0.080%), Immigrants from Scotland (10.6%, a difference of 0.11%), Eastern European (10.6%, a difference of 0.24%), Swedish (10.6%, a difference of 0.34%), and Italian (10.6%, a difference of 0.39%).
DemographicsRating | RankPoverty
Immigrants | Hong Kong
99.8
/100
|
#13
Exceptional
10.4%
Immigrants | Bolivia
99.8
/100
|
#14
Exceptional
10.4%
Bolivians
99.8
/100
|
#15
Exceptional
10.4%
Lithuanians
99.8
/100
|
#16
Exceptional
10.5%
Norwegians
99.8
/100
|
#17
Exceptional
10.5%
Latvians
99.8
/100
|
#18
Exceptional
10.5%
Immigrants | Scotland
99.7
/100
|
#19
Exceptional
10.6%
Immigrants | North Macedonia
99.7
/100
|
#20
Exceptional
10.6%
Luxembourgers
99.7
/100
|
#21
Exceptional
10.6%
Eastern Europeans
99.7
/100
|
#22
Exceptional
10.6%
Swedes
99.7
/100
|
#23
Exceptional
10.6%
Italians
99.7
/100
|
#24
Exceptional
10.6%
Croatians
99.6
/100
|
#25
Exceptional
10.6%
Burmese
99.6
/100
|
#26
Exceptional
10.7%
Immigrants | Northern Europe
99.6
/100
|
#27
Exceptional
10.7%

Demographics Similar to Immigrants from Jamaica by Poverty

In terms of poverty, the demographic groups most similar to Immigrants from Jamaica are Jamaican (14.4%, a difference of 0.090%), Immigrants from Guyana (14.5%, a difference of 0.13%), Guyanese (14.5%, a difference of 0.30%), Immigrants from Liberia (14.4%, a difference of 0.43%), and Cherokee (14.4%, a difference of 0.60%).
DemographicsRating | RankPoverty
Trinidadians and Tobagonians
0.1
/100
|
#257
Tragic
14.3%
Ottawa
0.1
/100
|
#258
Tragic
14.3%
Immigrants | Nicaragua
0.1
/100
|
#259
Tragic
14.3%
Cape Verdeans
0.1
/100
|
#260
Tragic
14.4%
Cherokee
0.1
/100
|
#261
Tragic
14.4%
Immigrants | Liberia
0.1
/100
|
#262
Tragic
14.4%
Jamaicans
0.1
/100
|
#263
Tragic
14.4%
Immigrants | Jamaica
0.1
/100
|
#264
Tragic
14.4%
Immigrants | Guyana
0.1
/100
|
#265
Tragic
14.5%
Guyanese
0.1
/100
|
#266
Tragic
14.5%
Iroquois
0.1
/100
|
#267
Tragic
14.5%
Sub-Saharan Africans
0.1
/100
|
#268
Tragic
14.5%
Immigrants | Cuba
0.1
/100
|
#269
Tragic
14.6%
Central Americans
0.1
/100
|
#270
Tragic
14.6%
Shoshone
0.0
/100
|
#271
Tragic
14.7%