Immigrants from North Macedonia vs Cheyenne Female Poverty
COMPARE
Immigrants from North Macedonia
Cheyenne
Female Poverty
Female Poverty Comparison
Immigrants from North Macedonia
Cheyenne
11.7%
FEMALE POVERTY
99.6/ 100
METRIC RATING
29th/ 347
METRIC RANK
20.2%
FEMALE POVERTY
0.0/ 100
METRIC RATING
335th/ 347
METRIC RANK
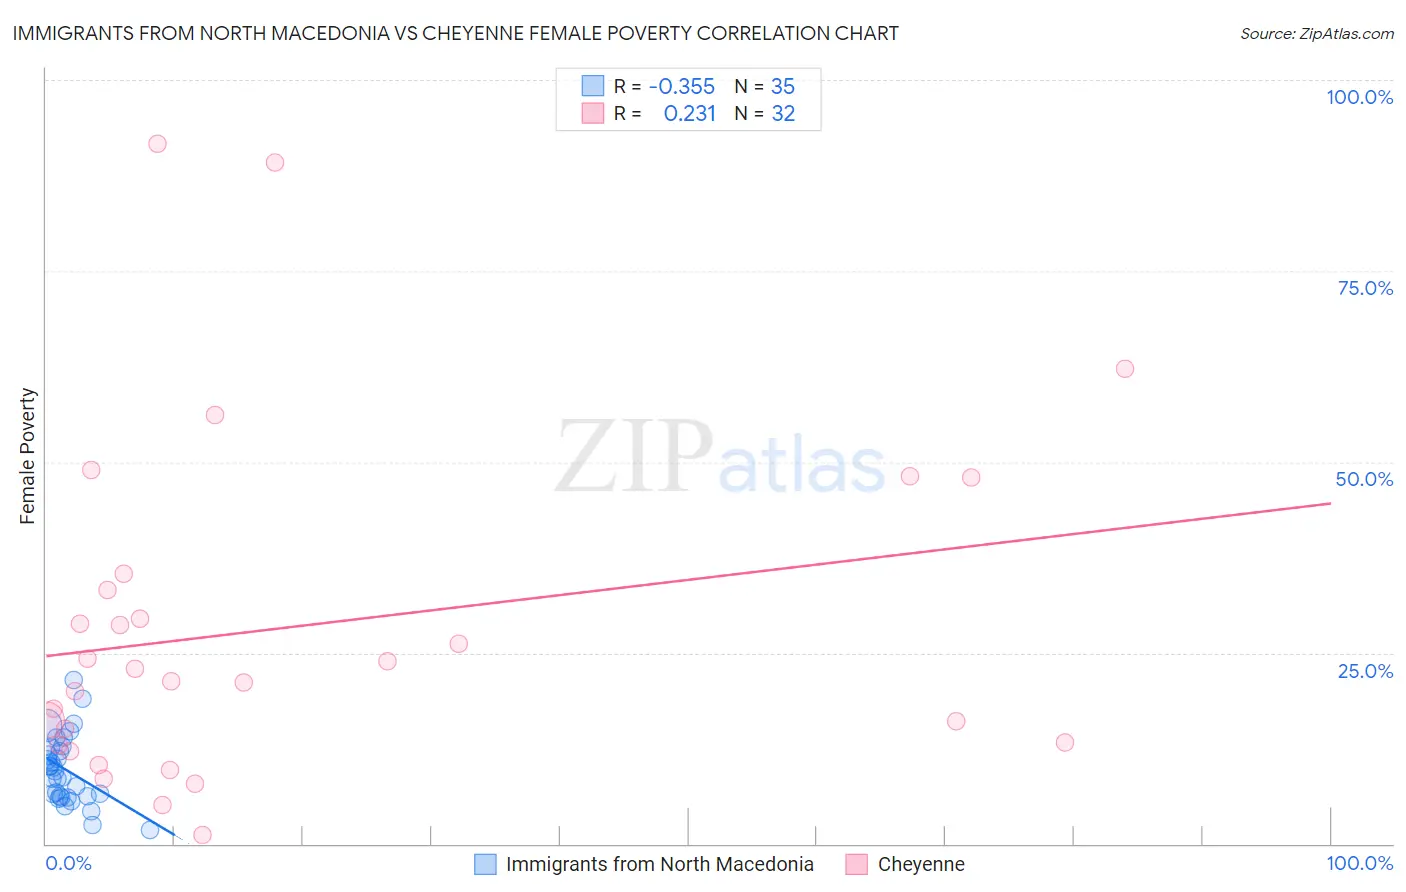
Immigrants from North Macedonia vs Cheyenne Female Poverty Correlation Chart
The statistical analysis conducted on geographies consisting of 74,287,962 people shows a mild negative correlation between the proportion of Immigrants from North Macedonia and poverty level among females in the United States with a correlation coefficient (R) of -0.355 and weighted average of 11.7%. Similarly, the statistical analysis conducted on geographies consisting of 80,704,205 people shows a weak positive correlation between the proportion of Cheyenne and poverty level among females in the United States with a correlation coefficient (R) of 0.231 and weighted average of 20.2%, a difference of 72.7%.
Female Poverty Correlation Summary
| Measurement | Immigrants from North Macedonia | Cheyenne |
| Minimum | 1.8% | 1.1% |
| Maximum | 21.5% | 91.7% |
| Range | 19.7% | 90.6% |
| Mean | 9.7% | 28.3% |
| Median | 9.6% | 22.0% |
| Interquartile 25% (IQ1) | 6.3% | 13.1% |
| Interquartile 75% (IQ3) | 12.6% | 34.3% |
| Interquartile Range (IQR) | 6.3% | 21.2% |
| Standard Deviation (Sample) | 4.4% | 22.2% |
| Standard Deviation (Population) | 4.4% | 21.8% |
Similar Demographics by Female Poverty
Demographics Similar to Immigrants from North Macedonia by Female Poverty
In terms of female poverty, the demographic groups most similar to Immigrants from North Macedonia are Greek (11.7%, a difference of 0.080%), Immigrants from Korea (11.7%, a difference of 0.15%), Polish (11.7%, a difference of 0.30%), Iranian (11.7%, a difference of 0.36%), and Danish (11.7%, a difference of 0.43%).
| Demographics | Rating | Rank | Female Poverty |
| Swedes | 99.7 /100 | #22 | Exceptional 11.6% |
| Burmese | 99.7 /100 | #23 | Exceptional 11.6% |
| Luxembourgers | 99.7 /100 | #24 | Exceptional 11.6% |
| Immigrants | Northern Europe | 99.6 /100 | #25 | Exceptional 11.6% |
| Croatians | 99.6 /100 | #26 | Exceptional 11.6% |
| Iranians | 99.6 /100 | #27 | Exceptional 11.7% |
| Immigrants | Korea | 99.6 /100 | #28 | Exceptional 11.7% |
| Immigrants | North Macedonia | 99.6 /100 | #29 | Exceptional 11.7% |
| Greeks | 99.5 /100 | #30 | Exceptional 11.7% |
| Poles | 99.5 /100 | #31 | Exceptional 11.7% |
| Danes | 99.5 /100 | #32 | Exceptional 11.7% |
| Cypriots | 99.5 /100 | #33 | Exceptional 11.8% |
| Immigrants | Singapore | 99.4 /100 | #34 | Exceptional 11.8% |
| Immigrants | Iran | 99.4 /100 | #35 | Exceptional 11.8% |
| Immigrants | Pakistan | 99.4 /100 | #36 | Exceptional 11.8% |
Demographics Similar to Cheyenne by Female Poverty
In terms of female poverty, the demographic groups most similar to Cheyenne are Houma (20.0%, a difference of 0.77%), Pueblo (20.7%, a difference of 2.4%), Yuman (20.8%, a difference of 3.2%), Sioux (20.9%, a difference of 3.4%), and Hopi (21.0%, a difference of 3.8%).
| Demographics | Rating | Rank | Female Poverty |
| Blacks/African Americans | 0.0 /100 | #328 | Tragic 18.6% |
| Kiowa | 0.0 /100 | #329 | Tragic 18.6% |
| Dominicans | 0.0 /100 | #330 | Tragic 19.1% |
| Natives/Alaskans | 0.0 /100 | #331 | Tragic 19.2% |
| Apache | 0.0 /100 | #332 | Tragic 19.2% |
| Immigrants | Dominican Republic | 0.0 /100 | #333 | Tragic 19.3% |
| Houma | 0.0 /100 | #334 | Tragic 20.0% |
| Cheyenne | 0.0 /100 | #335 | Tragic 20.2% |
| Pueblo | 0.0 /100 | #336 | Tragic 20.7% |
| Yuman | 0.0 /100 | #337 | Tragic 20.8% |
| Sioux | 0.0 /100 | #338 | Tragic 20.9% |
| Hopi | 0.0 /100 | #339 | Tragic 21.0% |
| Yup'ik | 0.0 /100 | #340 | Tragic 21.5% |
| Crow | 0.0 /100 | #341 | Tragic 22.1% |
| Immigrants | Yemen | 0.0 /100 | #342 | Tragic 22.8% |