Immigrants from Nicaragua vs Indian (Asian) Seniors Poverty Over the Age of 75
COMPARE
Immigrants from Nicaragua
Indian (Asian)
Seniors Poverty Over the Age of 75
Seniors Poverty Over the Age of 75 Comparison
Immigrants from Nicaragua
Indians (Asian)
17.6%
SENIORS POVERTY OVER THE AGE OF 75
0.0/ 100
METRIC RATING
333rd/ 347
METRIC RANK
12.7%
SENIORS POVERTY OVER THE AGE OF 75
9.7/ 100
METRIC RATING
205th/ 347
METRIC RANK
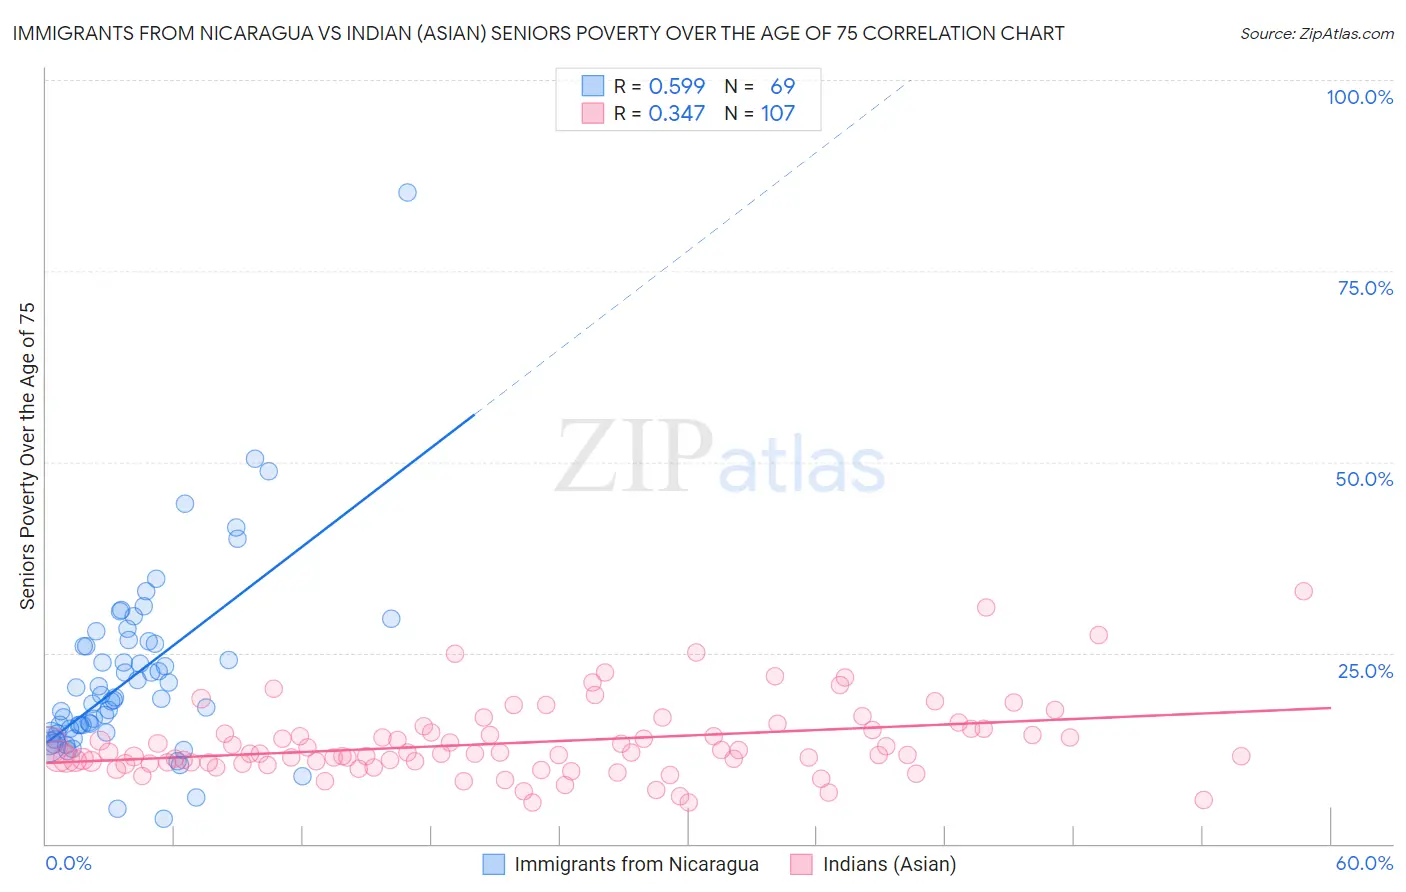
Immigrants from Nicaragua vs Indian (Asian) Seniors Poverty Over the Age of 75 Correlation Chart
The statistical analysis conducted on geographies consisting of 235,301,919 people shows a substantial positive correlation between the proportion of Immigrants from Nicaragua and poverty level among seniors over the age of 75 in the United States with a correlation coefficient (R) of 0.599 and weighted average of 17.6%. Similarly, the statistical analysis conducted on geographies consisting of 486,315,330 people shows a mild positive correlation between the proportion of Indians (Asian) and poverty level among seniors over the age of 75 in the United States with a correlation coefficient (R) of 0.347 and weighted average of 12.7%, a difference of 38.0%.
Seniors Poverty Over the Age of 75 Correlation Summary
| Measurement | Immigrants from Nicaragua | Indian (Asian) |
| Minimum | 3.3% | 5.3% |
| Maximum | 85.2% | 33.1% |
| Range | 82.0% | 27.8% |
| Mean | 22.0% | 13.3% |
| Median | 19.0% | 11.8% |
| Interquartile 25% (IQ1) | 14.6% | 10.6% |
| Interquartile 75% (IQ3) | 26.3% | 14.9% |
| Interquartile Range (IQR) | 11.7% | 4.2% |
| Standard Deviation (Sample) | 12.3% | 5.0% |
| Standard Deviation (Population) | 12.2% | 5.0% |
Similar Demographics by Seniors Poverty Over the Age of 75
Demographics Similar to Immigrants from Nicaragua by Seniors Poverty Over the Age of 75
In terms of seniors poverty over the age of 75, the demographic groups most similar to Immigrants from Nicaragua are Immigrants from St. Vincent and the Grenadines (17.5%, a difference of 0.47%), Immigrants from Armenia (17.5%, a difference of 0.74%), British West Indian (17.4%, a difference of 0.99%), Immigrants from Grenada (17.8%, a difference of 1.5%), and Cuban (18.0%, a difference of 2.1%).
| Demographics | Rating | Rank | Seniors Poverty Over the Age of 75 |
| Pueblo | 0.0 /100 | #326 | Tragic 16.7% |
| Sioux | 0.0 /100 | #327 | Tragic 16.8% |
| Cape Verdeans | 0.0 /100 | #328 | Tragic 16.8% |
| Immigrants | Dominica | 0.0 /100 | #329 | Tragic 17.0% |
| British West Indians | 0.0 /100 | #330 | Tragic 17.4% |
| Immigrants | Armenia | 0.0 /100 | #331 | Tragic 17.5% |
| Immigrants | St. Vincent and the Grenadines | 0.0 /100 | #332 | Tragic 17.5% |
| Immigrants | Nicaragua | 0.0 /100 | #333 | Tragic 17.6% |
| Immigrants | Grenada | 0.0 /100 | #334 | Tragic 17.8% |
| Cubans | 0.0 /100 | #335 | Tragic 18.0% |
| Immigrants | Caribbean | 0.0 /100 | #336 | Tragic 18.2% |
| Yakama | 0.0 /100 | #337 | Tragic 18.3% |
| Immigrants | Cabo Verde | 0.0 /100 | #338 | Tragic 18.5% |
| Hopi | 0.0 /100 | #339 | Tragic 18.9% |
| Tohono O'odham | 0.0 /100 | #340 | Tragic 19.1% |
Demographics Similar to Indians (Asian) by Seniors Poverty Over the Age of 75
In terms of seniors poverty over the age of 75, the demographic groups most similar to Indians (Asian) are Albanian (12.7%, a difference of 0.040%), Immigrants from Eritrea (12.7%, a difference of 0.16%), Immigrants from Southern Europe (12.7%, a difference of 0.19%), Costa Rican (12.8%, a difference of 0.24%), and Arapaho (12.7%, a difference of 0.25%).
| Demographics | Rating | Rank | Seniors Poverty Over the Age of 75 |
| Chileans | 13.7 /100 | #198 | Poor 12.6% |
| Immigrants | Lebanon | 12.7 /100 | #199 | Poor 12.7% |
| Immigrants | Vietnam | 12.1 /100 | #200 | Poor 12.7% |
| Paraguayans | 11.1 /100 | #201 | Poor 12.7% |
| Arapaho | 10.9 /100 | #202 | Poor 12.7% |
| Immigrants | Southern Europe | 10.7 /100 | #203 | Poor 12.7% |
| Immigrants | Eritrea | 10.5 /100 | #204 | Poor 12.7% |
| Indians (Asian) | 9.7 /100 | #205 | Tragic 12.7% |
| Albanians | 9.6 /100 | #206 | Tragic 12.7% |
| Costa Ricans | 8.7 /100 | #207 | Tragic 12.8% |
| Immigrants | Eastern Asia | 8.4 /100 | #208 | Tragic 12.8% |
| Immigrants | Liberia | 7.3 /100 | #209 | Tragic 12.8% |
| Comanche | 7.0 /100 | #210 | Tragic 12.8% |
| Brazilians | 6.9 /100 | #211 | Tragic 12.8% |
| Immigrants | Hong Kong | 6.5 /100 | #212 | Tragic 12.8% |