Immigrants from Nicaragua vs Immigrants from Venezuela Child Poverty Among Boys Under 16
COMPARE
Immigrants from Nicaragua
Immigrants from Venezuela
Child Poverty Among Boys Under 16
Child Poverty Among Boys Under 16 Comparison
Immigrants from Nicaragua
Immigrants from Venezuela
19.0%
CHILD POVERTY AMONG BOYS UNDER 16
0.4/ 100
METRIC RATING
246th/ 347
METRIC RANK
15.8%
CHILD POVERTY AMONG BOYS UNDER 16
79.5/ 100
METRIC RATING
152nd/ 347
METRIC RANK
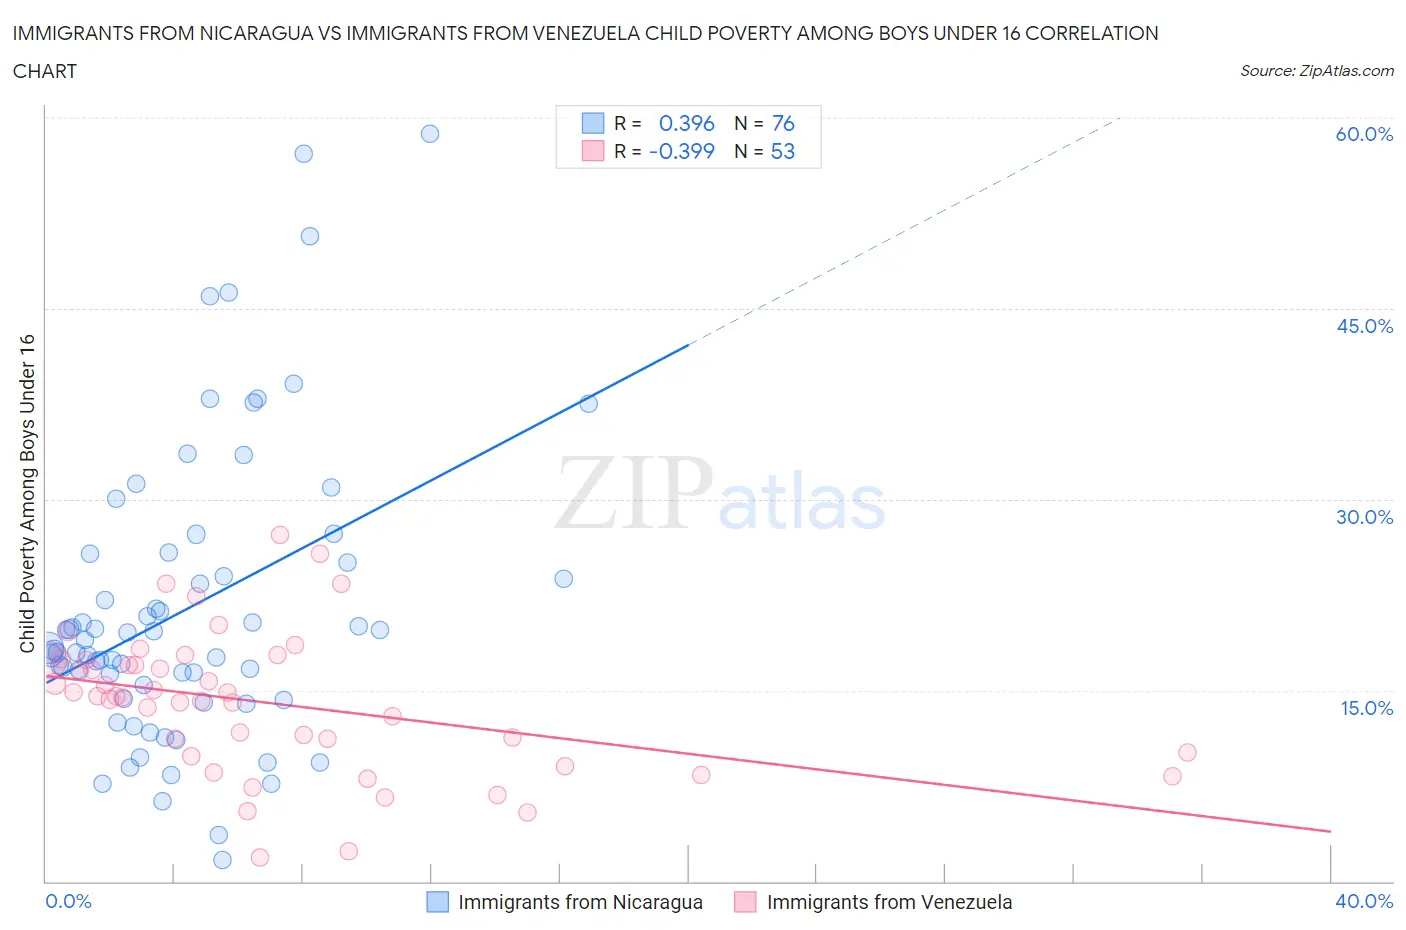
Immigrants from Nicaragua vs Immigrants from Venezuela Child Poverty Among Boys Under 16 Correlation Chart
The statistical analysis conducted on geographies consisting of 235,106,184 people shows a mild positive correlation between the proportion of Immigrants from Nicaragua and poverty level among boys under the age of 16 in the United States with a correlation coefficient (R) of 0.396 and weighted average of 19.0%. Similarly, the statistical analysis conducted on geographies consisting of 285,017,415 people shows a mild negative correlation between the proportion of Immigrants from Venezuela and poverty level among boys under the age of 16 in the United States with a correlation coefficient (R) of -0.399 and weighted average of 15.8%, a difference of 20.2%.
Child Poverty Among Boys Under 16 Correlation Summary
| Measurement | Immigrants from Nicaragua | Immigrants from Venezuela |
| Minimum | 1.7% | 1.9% |
| Maximum | 58.8% | 27.2% |
| Range | 57.0% | 25.3% |
| Mean | 21.4% | 14.0% |
| Median | 18.6% | 14.5% |
| Interquartile 25% (IQ1) | 14.9% | 9.9% |
| Interquartile 75% (IQ3) | 25.4% | 17.4% |
| Interquartile Range (IQR) | 10.5% | 7.5% |
| Standard Deviation (Sample) | 11.5% | 5.5% |
| Standard Deviation (Population) | 11.4% | 5.5% |
Similar Demographics by Child Poverty Among Boys Under 16
Demographics Similar to Immigrants from Nicaragua by Child Poverty Among Boys Under 16
In terms of child poverty among boys under 16, the demographic groups most similar to Immigrants from Nicaragua are Immigrants from Trinidad and Tobago (19.0%, a difference of 0.12%), Cree (19.0%, a difference of 0.20%), Salvadoran (19.0%, a difference of 0.20%), Immigrants from Middle Africa (18.9%, a difference of 0.33%), and Immigrants from the Azores (18.9%, a difference of 0.34%).
| Demographics | Rating | Rank | Child Poverty Among Boys Under 16 |
| Cape Verdeans | 0.7 /100 | #239 | Tragic 18.7% |
| Immigrants | Cuba | 0.6 /100 | #240 | Tragic 18.8% |
| Immigrants | Sudan | 0.6 /100 | #241 | Tragic 18.8% |
| Ghanaians | 0.5 /100 | #242 | Tragic 18.9% |
| Immigrants | Azores | 0.4 /100 | #243 | Tragic 18.9% |
| Immigrants | Middle Africa | 0.4 /100 | #244 | Tragic 18.9% |
| Cree | 0.4 /100 | #245 | Tragic 19.0% |
| Immigrants | Nicaragua | 0.4 /100 | #246 | Tragic 19.0% |
| Immigrants | Trinidad and Tobago | 0.3 /100 | #247 | Tragic 19.0% |
| Salvadorans | 0.3 /100 | #248 | Tragic 19.0% |
| Alsatians | 0.3 /100 | #249 | Tragic 19.1% |
| Immigrants | Burma/Myanmar | 0.2 /100 | #250 | Tragic 19.2% |
| French American Indians | 0.2 /100 | #251 | Tragic 19.2% |
| Immigrants | Western Africa | 0.2 /100 | #252 | Tragic 19.3% |
| Liberians | 0.2 /100 | #253 | Tragic 19.3% |
Demographics Similar to Immigrants from Venezuela by Child Poverty Among Boys Under 16
In terms of child poverty among boys under 16, the demographic groups most similar to Immigrants from Venezuela are Puget Sound Salish (15.8%, a difference of 0.050%), Immigrants from Jordan (15.8%, a difference of 0.13%), Slovak (15.8%, a difference of 0.14%), French (15.8%, a difference of 0.14%), and Brazilian (15.8%, a difference of 0.28%).
| Demographics | Rating | Rank | Child Poverty Among Boys Under 16 |
| Samoans | 83.2 /100 | #145 | Excellent 15.7% |
| New Zealanders | 82.4 /100 | #146 | Excellent 15.7% |
| Venezuelans | 82.1 /100 | #147 | Excellent 15.7% |
| Brazilians | 81.0 /100 | #148 | Excellent 15.8% |
| Slovaks | 80.3 /100 | #149 | Excellent 15.8% |
| Immigrants | Jordan | 80.2 /100 | #150 | Excellent 15.8% |
| Puget Sound Salish | 79.8 /100 | #151 | Good 15.8% |
| Immigrants | Venezuela | 79.5 /100 | #152 | Good 15.8% |
| French | 78.7 /100 | #153 | Good 15.8% |
| Syrians | 77.5 /100 | #154 | Good 15.9% |
| French Canadians | 76.6 /100 | #155 | Good 15.9% |
| Israelis | 76.5 /100 | #156 | Good 15.9% |
| Immigrants | Nepal | 76.0 /100 | #157 | Good 15.9% |
| Yugoslavians | 75.9 /100 | #158 | Good 15.9% |
| Immigrants | Chile | 74.8 /100 | #159 | Good 15.9% |