Immigrants from Nicaragua vs Hawaiian Single Female Poverty
COMPARE
Immigrants from Nicaragua
Hawaiian
Single Female Poverty
Single Female Poverty Comparison
Immigrants from Nicaragua
Hawaiians
21.6%
SINGLE FEMALE POVERTY
13.3/ 100
METRIC RATING
214th/ 347
METRIC RANK
21.2%
SINGLE FEMALE POVERTY
37.7/ 100
METRIC RATING
186th/ 347
METRIC RANK
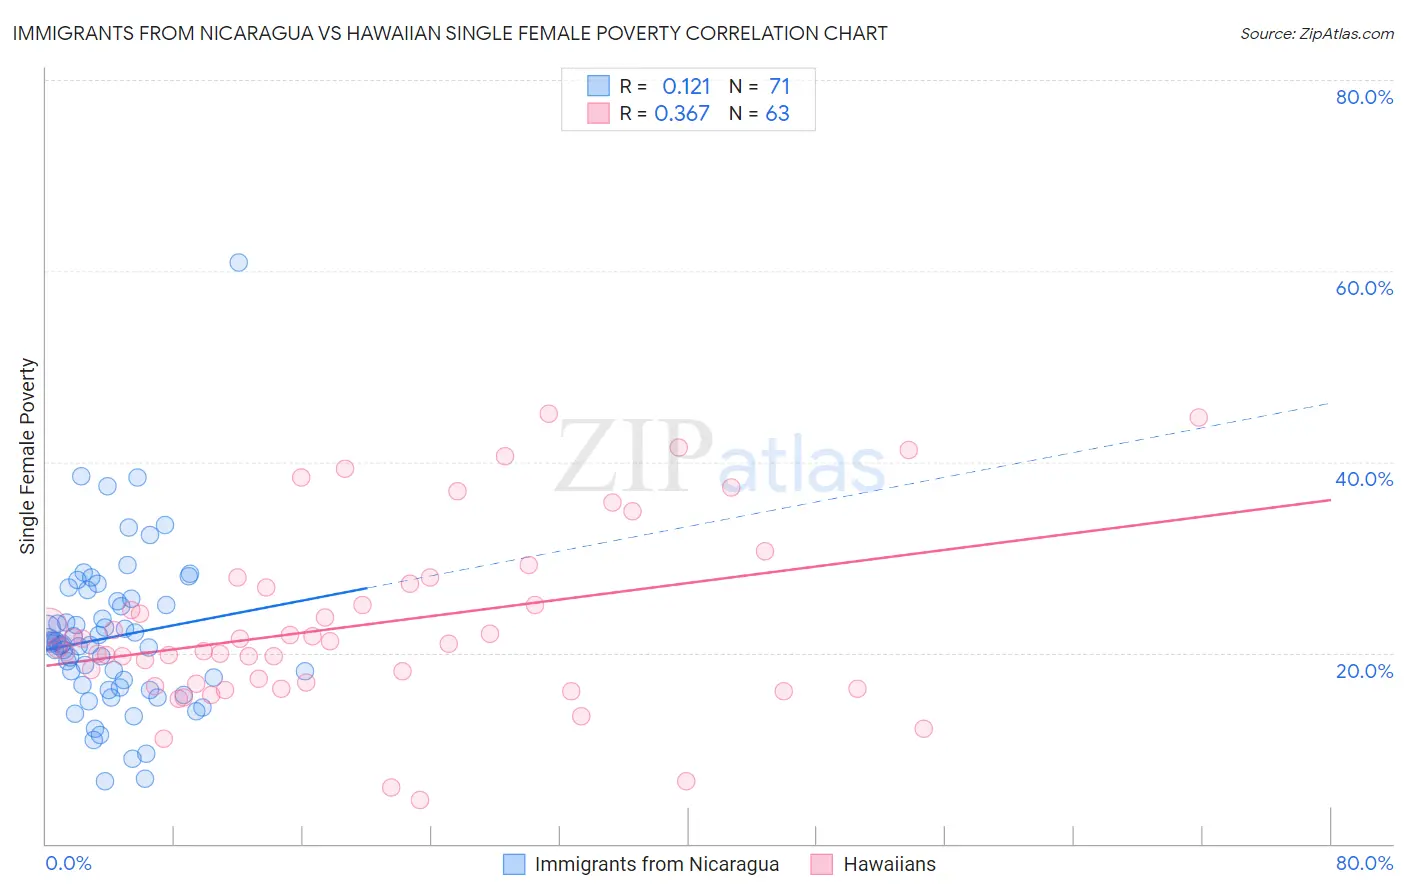
Immigrants from Nicaragua vs Hawaiian Single Female Poverty Correlation Chart
The statistical analysis conducted on geographies consisting of 235,216,654 people shows a poor positive correlation between the proportion of Immigrants from Nicaragua and poverty level among single females in the United States with a correlation coefficient (R) of 0.121 and weighted average of 21.6%. Similarly, the statistical analysis conducted on geographies consisting of 324,430,861 people shows a mild positive correlation between the proportion of Hawaiians and poverty level among single females in the United States with a correlation coefficient (R) of 0.367 and weighted average of 21.2%, a difference of 2.1%.
Single Female Poverty Correlation Summary
| Measurement | Immigrants from Nicaragua | Hawaiian |
| Minimum | 6.5% | 4.5% |
| Maximum | 60.9% | 45.0% |
| Range | 54.4% | 40.5% |
| Mean | 21.6% | 23.0% |
| Median | 21.0% | 20.9% |
| Interquartile 25% (IQ1) | 16.3% | 16.7% |
| Interquartile 75% (IQ3) | 25.4% | 27.3% |
| Interquartile Range (IQR) | 9.1% | 10.5% |
| Standard Deviation (Sample) | 8.3% | 9.3% |
| Standard Deviation (Population) | 8.3% | 9.2% |
Similar Demographics by Single Female Poverty
Demographics Similar to Immigrants from Nicaragua by Single Female Poverty
In terms of single female poverty, the demographic groups most similar to Immigrants from Nicaragua are Guamanian/Chamorro (21.6%, a difference of 0.060%), Jamaican (21.6%, a difference of 0.090%), Icelander (21.6%, a difference of 0.10%), Ecuadorian (21.6%, a difference of 0.13%), and Immigrants from Panama (21.6%, a difference of 0.14%).
| Demographics | Rating | Rank | Single Female Poverty |
| Ghanaians | 15.7 /100 | #207 | Poor 21.6% |
| Haitians | 15.4 /100 | #208 | Poor 21.6% |
| Immigrants | Eastern Africa | 15.1 /100 | #209 | Poor 21.6% |
| Immigrants | Panama | 14.4 /100 | #210 | Poor 21.6% |
| Icelanders | 14.0 /100 | #211 | Poor 21.6% |
| Jamaicans | 14.0 /100 | #212 | Poor 21.6% |
| Guamanians/Chamorros | 13.7 /100 | #213 | Poor 21.6% |
| Immigrants | Nicaragua | 13.3 /100 | #214 | Poor 21.6% |
| Ecuadorians | 12.3 /100 | #215 | Poor 21.6% |
| Immigrants | Barbados | 12.2 /100 | #216 | Poor 21.7% |
| Immigrants | St. Vincent and the Grenadines | 11.7 /100 | #217 | Poor 21.7% |
| Nepalese | 9.7 /100 | #218 | Tragic 21.7% |
| Panamanians | 9.4 /100 | #219 | Tragic 21.7% |
| Germans | 8.3 /100 | #220 | Tragic 21.8% |
| Immigrants | Grenada | 8.0 /100 | #221 | Tragic 21.8% |
Demographics Similar to Hawaiians by Single Female Poverty
In terms of single female poverty, the demographic groups most similar to Hawaiians are Immigrants from Cambodia (21.2%, a difference of 0.040%), Immigrants from Nigeria (21.2%, a difference of 0.060%), Hungarian (21.1%, a difference of 0.13%), Slovak (21.1%, a difference of 0.14%), and Yugoslavian (21.2%, a difference of 0.15%).
| Demographics | Rating | Rank | Single Female Poverty |
| British | 42.9 /100 | #179 | Average 21.1% |
| Spanish American Indians | 42.5 /100 | #180 | Average 21.1% |
| Europeans | 42.3 /100 | #181 | Average 21.1% |
| Slavs | 40.5 /100 | #182 | Average 21.1% |
| Slovaks | 39.7 /100 | #183 | Fair 21.1% |
| Hungarians | 39.6 /100 | #184 | Fair 21.1% |
| Immigrants | Cambodia | 38.2 /100 | #185 | Fair 21.2% |
| Hawaiians | 37.7 /100 | #186 | Fair 21.2% |
| Immigrants | Nigeria | 36.8 /100 | #187 | Fair 21.2% |
| Yugoslavians | 35.4 /100 | #188 | Fair 21.2% |
| Immigrants | Cuba | 35.3 /100 | #189 | Fair 21.2% |
| Trinidadians and Tobagonians | 35.2 /100 | #190 | Fair 21.2% |
| Immigrants | Germany | 31.1 /100 | #191 | Fair 21.3% |
| Immigrants | Jamaica | 30.5 /100 | #192 | Fair 21.3% |
| Basques | 28.1 /100 | #193 | Fair 21.3% |