Immigrants from Netherlands vs Immigrants from South America Child Poverty Among Boys Under 16
COMPARE
Immigrants from Netherlands
Immigrants from South America
Child Poverty Among Boys Under 16
Child Poverty Among Boys Under 16 Comparison
Immigrants from Netherlands
Immigrants from South America
14.6%
CHILD POVERTY AMONG BOYS UNDER 16
98.1/ 100
METRIC RATING
71st/ 347
METRIC RANK
16.7%
CHILD POVERTY AMONG BOYS UNDER 16
37.7/ 100
METRIC RATING
188th/ 347
METRIC RANK
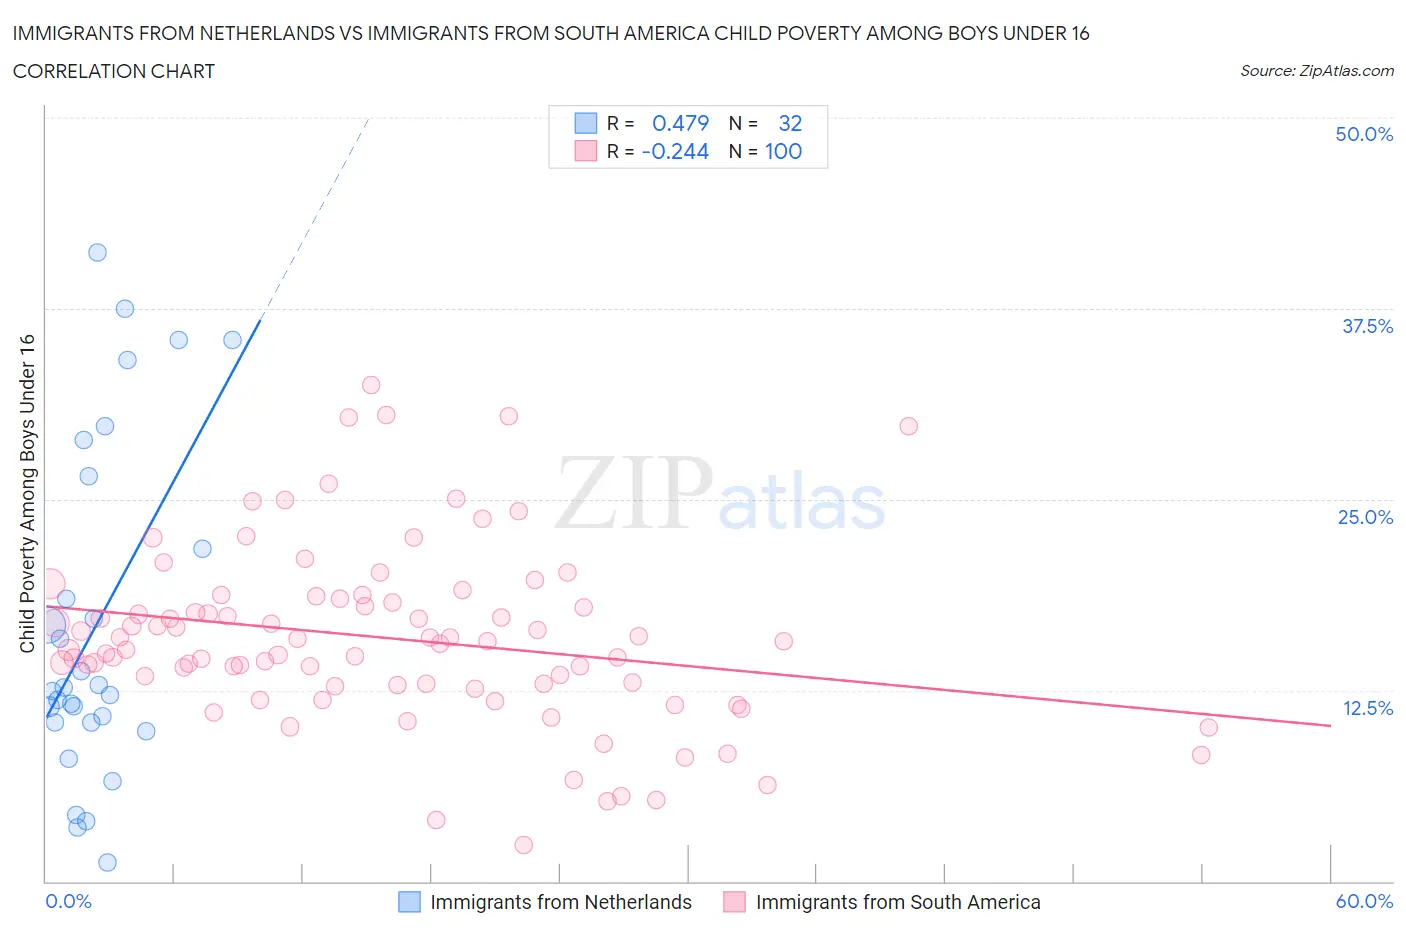
Immigrants from Netherlands vs Immigrants from South America Child Poverty Among Boys Under 16 Correlation Chart
The statistical analysis conducted on geographies consisting of 234,687,495 people shows a moderate positive correlation between the proportion of Immigrants from Netherlands and poverty level among boys under the age of 16 in the United States with a correlation coefficient (R) of 0.479 and weighted average of 14.6%. Similarly, the statistical analysis conducted on geographies consisting of 474,715,246 people shows a weak negative correlation between the proportion of Immigrants from South America and poverty level among boys under the age of 16 in the United States with a correlation coefficient (R) of -0.244 and weighted average of 16.7%, a difference of 13.9%.
Child Poverty Among Boys Under 16 Correlation Summary
| Measurement | Immigrants from Netherlands | Immigrants from South America |
| Minimum | 1.3% | 2.4% |
| Maximum | 41.1% | 32.5% |
| Range | 39.9% | 30.1% |
| Mean | 16.8% | 15.9% |
| Median | 12.5% | 15.6% |
| Interquartile 25% (IQ1) | 10.4% | 12.9% |
| Interquartile 75% (IQ3) | 24.1% | 18.4% |
| Interquartile Range (IQR) | 13.7% | 5.5% |
| Standard Deviation (Sample) | 11.0% | 5.8% |
| Standard Deviation (Population) | 10.8% | 5.8% |
Similar Demographics by Child Poverty Among Boys Under 16
Demographics Similar to Immigrants from Netherlands by Child Poverty Among Boys Under 16
In terms of child poverty among boys under 16, the demographic groups most similar to Immigrants from Netherlands are Immigrants from Latvia (14.6%, a difference of 0.010%), Immigrants from Turkey (14.6%, a difference of 0.060%), Australian (14.7%, a difference of 0.11%), Immigrants from Poland (14.7%, a difference of 0.18%), and Immigrants from Croatia (14.7%, a difference of 0.24%).
| Demographics | Rating | Rank | Child Poverty Among Boys Under 16 |
| Immigrants | Romania | 98.5 /100 | #64 | Exceptional 14.5% |
| Soviet Union | 98.5 /100 | #65 | Exceptional 14.5% |
| Immigrants | Bulgaria | 98.5 /100 | #66 | Exceptional 14.5% |
| Immigrants | Europe | 98.4 /100 | #67 | Exceptional 14.5% |
| Slovenes | 98.4 /100 | #68 | Exceptional 14.5% |
| Immigrants | Austria | 98.4 /100 | #69 | Exceptional 14.5% |
| Europeans | 98.4 /100 | #70 | Exceptional 14.5% |
| Immigrants | Netherlands | 98.1 /100 | #71 | Exceptional 14.6% |
| Immigrants | Latvia | 98.1 /100 | #72 | Exceptional 14.6% |
| Immigrants | Turkey | 98.0 /100 | #73 | Exceptional 14.6% |
| Australians | 98.0 /100 | #74 | Exceptional 14.7% |
| Immigrants | Poland | 97.9 /100 | #75 | Exceptional 14.7% |
| Immigrants | Croatia | 97.9 /100 | #76 | Exceptional 14.7% |
| Macedonians | 97.9 /100 | #77 | Exceptional 14.7% |
| Egyptians | 97.8 /100 | #78 | Exceptional 14.7% |
Demographics Similar to Immigrants from South America by Child Poverty Among Boys Under 16
In terms of child poverty among boys under 16, the demographic groups most similar to Immigrants from South America are Immigrants from Costa Rica (16.7%, a difference of 0.010%), Hmong (16.6%, a difference of 0.090%), Immigrants from Western Asia (16.6%, a difference of 0.31%), Celtic (16.6%, a difference of 0.34%), and Kenyan (16.6%, a difference of 0.38%).
| Demographics | Rating | Rank | Child Poverty Among Boys Under 16 |
| South American Indians | 44.3 /100 | #181 | Average 16.5% |
| Lebanese | 43.3 /100 | #182 | Average 16.6% |
| Kenyans | 41.0 /100 | #183 | Average 16.6% |
| Celtics | 40.6 /100 | #184 | Average 16.6% |
| Immigrants | Western Asia | 40.4 /100 | #185 | Average 16.6% |
| Hmong | 38.4 /100 | #186 | Fair 16.6% |
| Immigrants | Costa Rica | 37.8 /100 | #187 | Fair 16.7% |
| Immigrants | South America | 37.7 /100 | #188 | Fair 16.7% |
| Immigrants | Morocco | 34.5 /100 | #189 | Fair 16.7% |
| Arabs | 31.1 /100 | #190 | Fair 16.8% |
| Alaska Natives | 29.8 /100 | #191 | Fair 16.8% |
| Immigrants | Uganda | 21.6 /100 | #192 | Fair 17.0% |
| Immigrants | Iraq | 21.6 /100 | #193 | Fair 17.0% |
| Immigrants | Lebanon | 21.2 /100 | #194 | Fair 17.0% |
| Spanish | 20.8 /100 | #195 | Fair 17.0% |