Immigrants from Netherlands vs Cherokee Child Poverty Under the Age of 16
COMPARE
Immigrants from Netherlands
Cherokee
Child Poverty Under the Age of 16
Child Poverty Under the Age of 16 Comparison
Immigrants from Netherlands
Cherokee
14.3%
CHILD POVERTY UNDER THE AGE OF 16
97.9/ 100
METRIC RATING
70th/ 347
METRIC RANK
19.5%
CHILD POVERTY UNDER THE AGE OF 16
0.1/ 100
METRIC RATING
267th/ 347
METRIC RANK
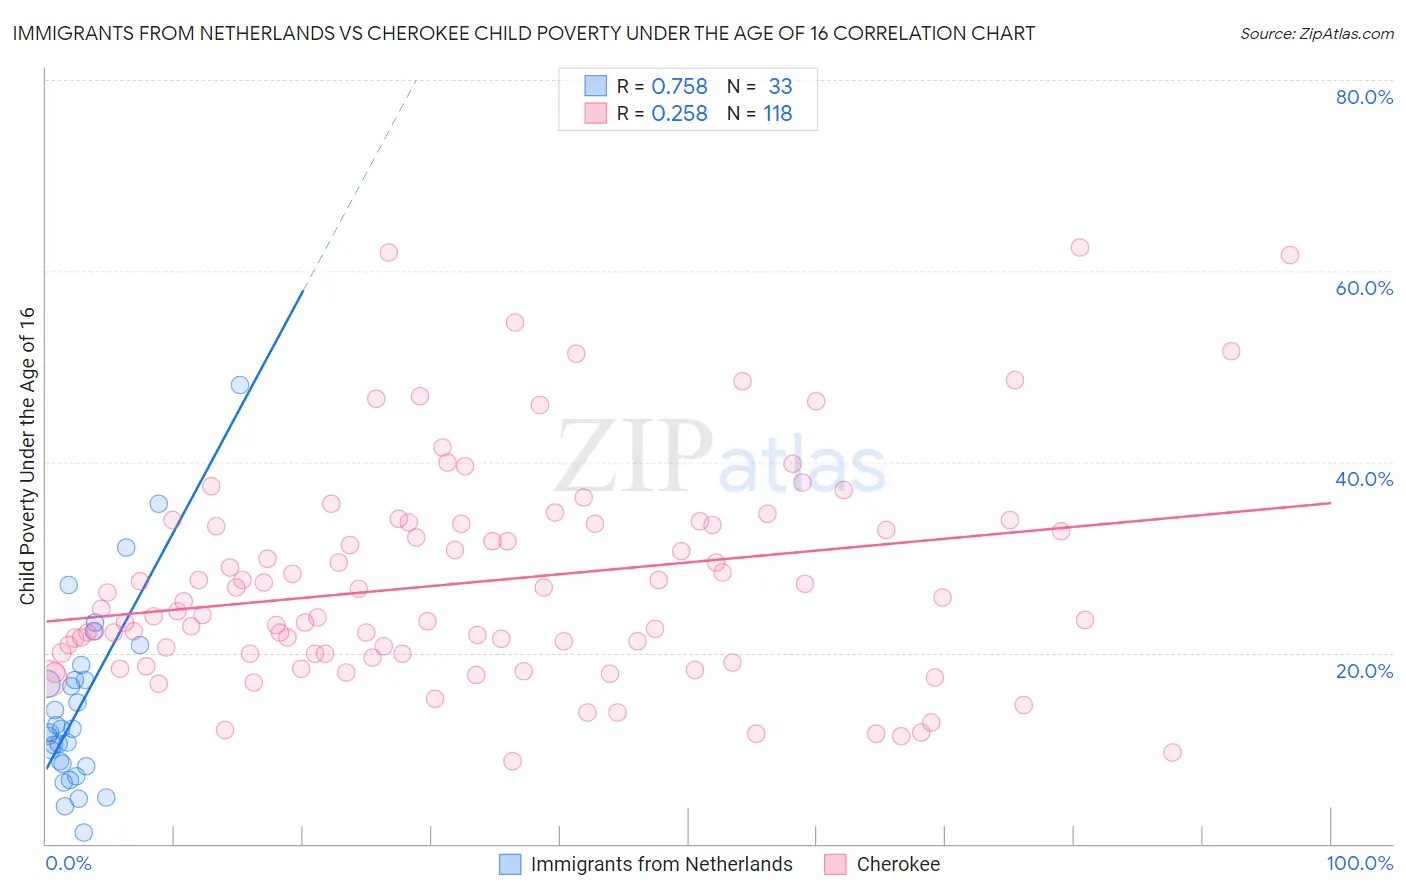
Immigrants from Netherlands vs Cherokee Child Poverty Under the Age of 16 Correlation Chart
The statistical analysis conducted on geographies consisting of 236,076,675 people shows a strong positive correlation between the proportion of Immigrants from Netherlands and poverty level among children under the age of 16 in the United States with a correlation coefficient (R) of 0.758 and weighted average of 14.3%. Similarly, the statistical analysis conducted on geographies consisting of 488,537,873 people shows a weak positive correlation between the proportion of Cherokee and poverty level among children under the age of 16 in the United States with a correlation coefficient (R) of 0.258 and weighted average of 19.5%, a difference of 36.4%.
Child Poverty Under the Age of 16 Correlation Summary
| Measurement | Immigrants from Netherlands | Cherokee |
| Minimum | 1.1% | 8.7% |
| Maximum | 48.1% | 62.5% |
| Range | 46.9% | 53.8% |
| Mean | 14.7% | 27.4% |
| Median | 12.0% | 24.5% |
| Interquartile 25% (IQ1) | 8.3% | 19.9% |
| Interquartile 75% (IQ3) | 17.9% | 33.5% |
| Interquartile Range (IQR) | 9.6% | 13.5% |
| Standard Deviation (Sample) | 9.8% | 11.2% |
| Standard Deviation (Population) | 9.7% | 11.2% |
Similar Demographics by Child Poverty Under the Age of 16
Demographics Similar to Immigrants from Netherlands by Child Poverty Under the Age of 16
In terms of child poverty under the age of 16, the demographic groups most similar to Immigrants from Netherlands are Immigrants from Poland (14.3%, a difference of 0.0%), Immigrants from Bulgaria (14.3%, a difference of 0.10%), Laotian (14.3%, a difference of 0.18%), Cambodian (14.4%, a difference of 0.23%), and European (14.3%, a difference of 0.28%).
| Demographics | Rating | Rank | Child Poverty Under the Age of 16 |
| Immigrants | Europe | 98.4 /100 | #63 | Exceptional 14.2% |
| Immigrants | Romania | 98.3 /100 | #64 | Exceptional 14.2% |
| Immigrants | Philippines | 98.2 /100 | #65 | Exceptional 14.3% |
| Slovenes | 98.1 /100 | #66 | Exceptional 14.3% |
| Europeans | 98.1 /100 | #67 | Exceptional 14.3% |
| Laotians | 98.0 /100 | #68 | Exceptional 14.3% |
| Immigrants | Bulgaria | 98.0 /100 | #69 | Exceptional 14.3% |
| Immigrants | Netherlands | 97.9 /100 | #70 | Exceptional 14.3% |
| Immigrants | Poland | 97.9 /100 | #71 | Exceptional 14.3% |
| Cambodians | 97.8 /100 | #72 | Exceptional 14.4% |
| Immigrants | Turkey | 97.6 /100 | #73 | Exceptional 14.4% |
| Macedonians | 97.6 /100 | #74 | Exceptional 14.4% |
| Ukrainians | 97.5 /100 | #75 | Exceptional 14.4% |
| Immigrants | Eastern Europe | 97.5 /100 | #76 | Exceptional 14.4% |
| Australians | 97.5 /100 | #77 | Exceptional 14.4% |
Demographics Similar to Cherokee by Child Poverty Under the Age of 16
In terms of child poverty under the age of 16, the demographic groups most similar to Cherokee are Liberian (19.5%, a difference of 0.29%), Chickasaw (19.5%, a difference of 0.40%), Immigrants from Ecuador (19.4%, a difference of 0.51%), Vietnamese (19.4%, a difference of 0.58%), and Jamaican (19.7%, a difference of 0.66%).
| Demographics | Rating | Rank | Child Poverty Under the Age of 16 |
| Guyanese | 0.2 /100 | #260 | Tragic 19.3% |
| Immigrants | Burma/Myanmar | 0.1 /100 | #261 | Tragic 19.4% |
| Immigrants | Guyana | 0.1 /100 | #262 | Tragic 19.4% |
| Vietnamese | 0.1 /100 | #263 | Tragic 19.4% |
| Immigrants | Ecuador | 0.1 /100 | #264 | Tragic 19.4% |
| Chickasaw | 0.1 /100 | #265 | Tragic 19.5% |
| Liberians | 0.1 /100 | #266 | Tragic 19.5% |
| Cherokee | 0.1 /100 | #267 | Tragic 19.5% |
| Jamaicans | 0.1 /100 | #268 | Tragic 19.7% |
| Immigrants | El Salvador | 0.1 /100 | #269 | Tragic 19.7% |
| Spanish American Indians | 0.1 /100 | #270 | Tragic 19.7% |
| Immigrants | Liberia | 0.1 /100 | #271 | Tragic 19.7% |
| Immigrants | Bangladesh | 0.1 /100 | #272 | Tragic 19.8% |
| Immigrants | Jamaica | 0.1 /100 | #273 | Tragic 19.8% |
| Immigrants | Cabo Verde | 0.1 /100 | #274 | Tragic 19.9% |