Immigrants from Nepal vs Slovene Child Poverty Among Girls Under 16
COMPARE
Immigrants from Nepal
Slovene
Child Poverty Among Girls Under 16
Child Poverty Among Girls Under 16 Comparison
Immigrants from Nepal
Slovenes
15.9%
CHILD POVERTY AMONG GIRLS UNDER 16
78.5/ 100
METRIC RATING
153rd/ 347
METRIC RANK
14.6%
CHILD POVERTY AMONG GIRLS UNDER 16
98.1/ 100
METRIC RATING
71st/ 347
METRIC RANK
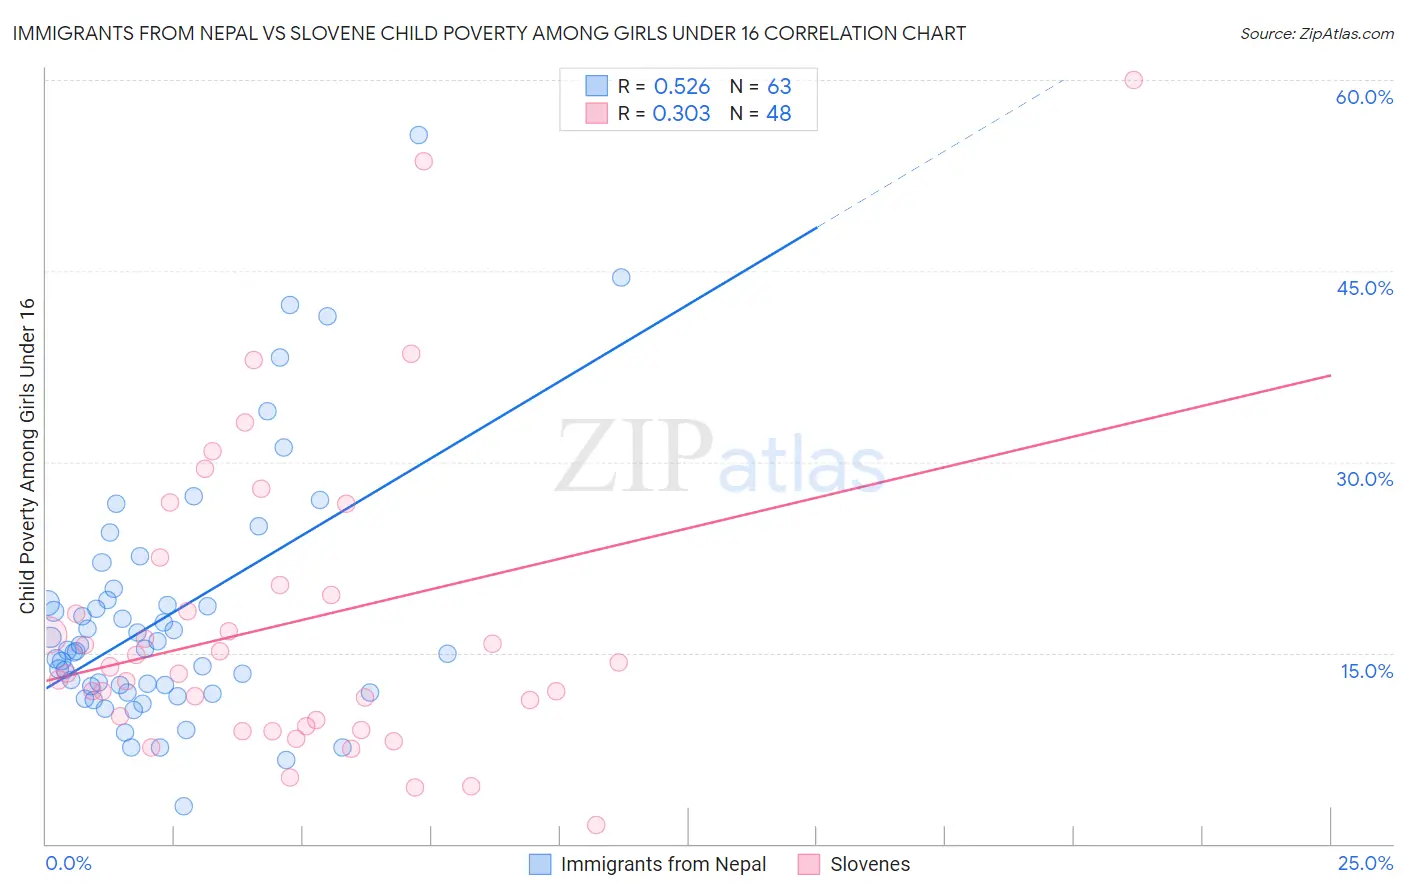
Immigrants from Nepal vs Slovene Child Poverty Among Girls Under 16 Correlation Chart
The statistical analysis conducted on geographies consisting of 185,239,456 people shows a substantial positive correlation between the proportion of Immigrants from Nepal and poverty level among girls under the age of 16 in the United States with a correlation coefficient (R) of 0.526 and weighted average of 15.9%. Similarly, the statistical analysis conducted on geographies consisting of 257,332,040 people shows a mild positive correlation between the proportion of Slovenes and poverty level among girls under the age of 16 in the United States with a correlation coefficient (R) of 0.303 and weighted average of 14.6%, a difference of 8.6%.
Child Poverty Among Girls Under 16 Correlation Summary
| Measurement | Immigrants from Nepal | Slovene |
| Minimum | 3.0% | 1.5% |
| Maximum | 55.7% | 60.0% |
| Range | 52.7% | 58.5% |
| Mean | 18.0% | 17.2% |
| Median | 15.2% | 13.6% |
| Interquartile 25% (IQ1) | 11.9% | 9.5% |
| Interquartile 75% (IQ3) | 19.1% | 19.9% |
| Interquartile Range (IQR) | 7.2% | 10.4% |
| Standard Deviation (Sample) | 9.9% | 11.9% |
| Standard Deviation (Population) | 9.8% | 11.8% |
Similar Demographics by Child Poverty Among Girls Under 16
Demographics Similar to Immigrants from Nepal by Child Poverty Among Girls Under 16
In terms of child poverty among girls under 16, the demographic groups most similar to Immigrants from Nepal are Immigrants from Kuwait (15.8%, a difference of 0.15%), Venezuelan (15.8%, a difference of 0.29%), Immigrants from Chile (15.9%, a difference of 0.31%), Syrian (15.9%, a difference of 0.32%), and Immigrants from Albania (15.8%, a difference of 0.40%).
| Demographics | Rating | Rank | Child Poverty Among Girls Under 16 |
| Samoans | 84.2 /100 | #146 | Excellent 15.7% |
| Slavs | 83.1 /100 | #147 | Excellent 15.7% |
| Icelanders | 82.4 /100 | #148 | Excellent 15.7% |
| Immigrants | Hungary | 80.9 /100 | #149 | Excellent 15.8% |
| Immigrants | Albania | 80.7 /100 | #150 | Excellent 15.8% |
| Venezuelans | 80.1 /100 | #151 | Excellent 15.8% |
| Immigrants | Kuwait | 79.4 /100 | #152 | Good 15.8% |
| Immigrants | Nepal | 78.5 /100 | #153 | Good 15.9% |
| Immigrants | Chile | 76.7 /100 | #154 | Good 15.9% |
| Syrians | 76.7 /100 | #155 | Good 15.9% |
| Immigrants | Fiji | 76.1 /100 | #156 | Good 15.9% |
| Colombians | 76.1 /100 | #157 | Good 15.9% |
| Guamanians/Chamorros | 75.3 /100 | #158 | Good 15.9% |
| Slovaks | 75.2 /100 | #159 | Good 15.9% |
| French | 72.8 /100 | #160 | Good 16.0% |
Demographics Similar to Slovenes by Child Poverty Among Girls Under 16
In terms of child poverty among girls under 16, the demographic groups most similar to Slovenes are Immigrants from Netherlands (14.6%, a difference of 0.030%), European (14.6%, a difference of 0.040%), Immigrants from Austria (14.6%, a difference of 0.12%), Taiwanese (14.6%, a difference of 0.15%), and Immigrants from Poland (14.6%, a difference of 0.16%).
| Demographics | Rating | Rank | Child Poverty Among Girls Under 16 |
| Immigrants | Philippines | 98.6 /100 | #64 | Exceptional 14.4% |
| Immigrants | Sweden | 98.6 /100 | #65 | Exceptional 14.5% |
| Immigrants | Belgium | 98.5 /100 | #66 | Exceptional 14.5% |
| Laotians | 98.4 /100 | #67 | Exceptional 14.5% |
| Immigrants | Argentina | 98.3 /100 | #68 | Exceptional 14.6% |
| Immigrants | Poland | 98.2 /100 | #69 | Exceptional 14.6% |
| Europeans | 98.1 /100 | #70 | Exceptional 14.6% |
| Slovenes | 98.1 /100 | #71 | Exceptional 14.6% |
| Immigrants | Netherlands | 98.1 /100 | #72 | Exceptional 14.6% |
| Immigrants | Austria | 98.0 /100 | #73 | Exceptional 14.6% |
| Taiwanese | 98.0 /100 | #74 | Exceptional 14.6% |
| Immigrants | Eastern Europe | 98.0 /100 | #75 | Exceptional 14.6% |
| Immigrants | Russia | 97.9 /100 | #76 | Exceptional 14.7% |
| Tlingit-Haida | 97.9 /100 | #77 | Exceptional 14.7% |
| Argentineans | 97.9 /100 | #78 | Exceptional 14.7% |