Immigrants from Nepal vs Immigrants from St. Vincent and the Grenadines Child Poverty Among Boys Under 16
COMPARE
Immigrants from Nepal
Immigrants from St. Vincent and the Grenadines
Child Poverty Among Boys Under 16
Child Poverty Among Boys Under 16 Comparison
Immigrants from Nepal
Immigrants from St. Vincent and the Grenadines
15.9%
CHILD POVERTY AMONG BOYS UNDER 16
76.0/ 100
METRIC RATING
157th/ 347
METRIC RANK
20.3%
CHILD POVERTY AMONG BOYS UNDER 16
0.0/ 100
METRIC RATING
288th/ 347
METRIC RANK
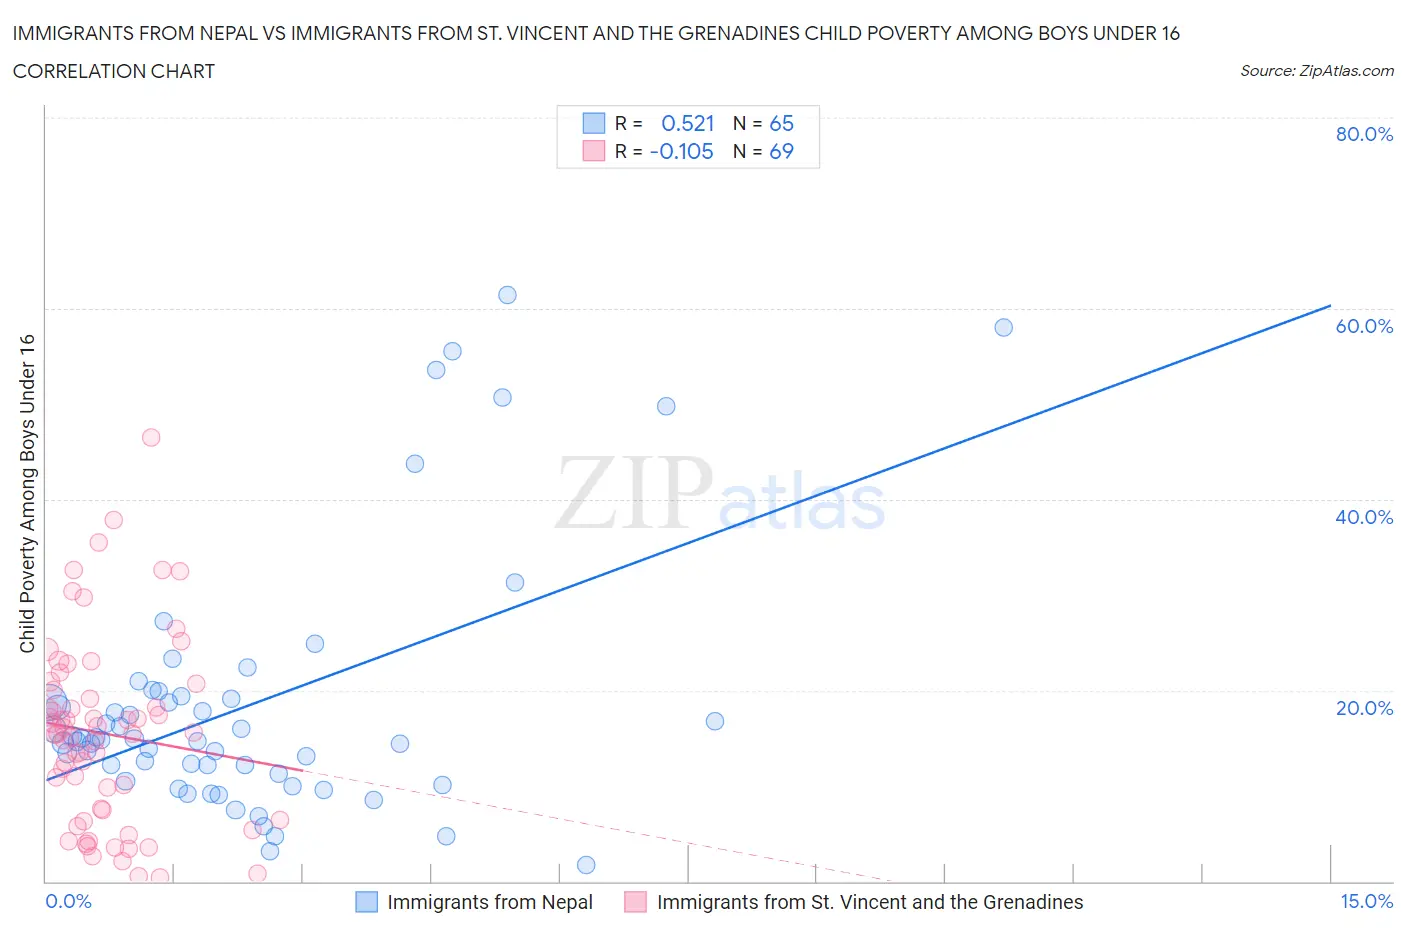
Immigrants from Nepal vs Immigrants from St. Vincent and the Grenadines Child Poverty Among Boys Under 16 Correlation Chart
The statistical analysis conducted on geographies consisting of 185,379,666 people shows a substantial positive correlation between the proportion of Immigrants from Nepal and poverty level among boys under the age of 16 in the United States with a correlation coefficient (R) of 0.521 and weighted average of 15.9%. Similarly, the statistical analysis conducted on geographies consisting of 56,103,487 people shows a poor negative correlation between the proportion of Immigrants from St. Vincent and the Grenadines and poverty level among boys under the age of 16 in the United States with a correlation coefficient (R) of -0.105 and weighted average of 20.3%, a difference of 27.7%.
Child Poverty Among Boys Under 16 Correlation Summary
| Measurement | Immigrants from Nepal | Immigrants from St. Vincent and the Grenadines |
| Minimum | 1.7% | 0.43% |
| Maximum | 61.5% | 46.4% |
| Range | 59.7% | 46.0% |
| Mean | 18.5% | 15.5% |
| Median | 14.8% | 15.5% |
| Interquartile 25% (IQ1) | 10.9% | 6.9% |
| Interquartile 75% (IQ3) | 19.2% | 20.3% |
| Interquartile Range (IQR) | 8.3% | 13.4% |
| Standard Deviation (Sample) | 13.5% | 9.8% |
| Standard Deviation (Population) | 13.3% | 9.7% |
Similar Demographics by Child Poverty Among Boys Under 16
Demographics Similar to Immigrants from Nepal by Child Poverty Among Boys Under 16
In terms of child poverty among boys under 16, the demographic groups most similar to Immigrants from Nepal are Yugoslavian (15.9%, a difference of 0.010%), Israeli (15.9%, a difference of 0.090%), French Canadian (15.9%, a difference of 0.10%), Immigrants from Chile (15.9%, a difference of 0.18%), and Syrian (15.9%, a difference of 0.25%).
| Demographics | Rating | Rank | Child Poverty Among Boys Under 16 |
| Immigrants | Jordan | 80.2 /100 | #150 | Excellent 15.8% |
| Puget Sound Salish | 79.8 /100 | #151 | Good 15.8% |
| Immigrants | Venezuela | 79.5 /100 | #152 | Good 15.8% |
| French | 78.7 /100 | #153 | Good 15.8% |
| Syrians | 77.5 /100 | #154 | Good 15.9% |
| French Canadians | 76.6 /100 | #155 | Good 15.9% |
| Israelis | 76.5 /100 | #156 | Good 15.9% |
| Immigrants | Nepal | 76.0 /100 | #157 | Good 15.9% |
| Yugoslavians | 75.9 /100 | #158 | Good 15.9% |
| Immigrants | Chile | 74.8 /100 | #159 | Good 15.9% |
| Immigrants | Northern Africa | 71.3 /100 | #160 | Good 16.0% |
| Immigrants | Oceania | 71.3 /100 | #161 | Good 16.0% |
| Guamanians/Chamorros | 69.6 /100 | #162 | Good 16.1% |
| Costa Ricans | 68.1 /100 | #163 | Good 16.1% |
| Immigrants | Albania | 67.9 /100 | #164 | Good 16.1% |
Demographics Similar to Immigrants from St. Vincent and the Grenadines by Child Poverty Among Boys Under 16
In terms of child poverty among boys under 16, the demographic groups most similar to Immigrants from St. Vincent and the Grenadines are Blackfeet (20.4%, a difference of 0.24%), Immigrants from Belize (20.3%, a difference of 0.27%), West Indian (20.3%, a difference of 0.33%), Arapaho (20.2%, a difference of 0.68%), and Barbadian (20.2%, a difference of 0.82%).
| Demographics | Rating | Rank | Child Poverty Among Boys Under 16 |
| Immigrants | Zaire | 0.0 /100 | #281 | Tragic 20.1% |
| Comanche | 0.0 /100 | #282 | Tragic 20.1% |
| Immigrants | Jamaica | 0.0 /100 | #283 | Tragic 20.1% |
| Barbadians | 0.0 /100 | #284 | Tragic 20.2% |
| Arapaho | 0.0 /100 | #285 | Tragic 20.2% |
| West Indians | 0.0 /100 | #286 | Tragic 20.3% |
| Immigrants | Belize | 0.0 /100 | #287 | Tragic 20.3% |
| Immigrants | St. Vincent and the Grenadines | 0.0 /100 | #288 | Tragic 20.3% |
| Blackfeet | 0.0 /100 | #289 | Tragic 20.4% |
| Senegalese | 0.0 /100 | #290 | Tragic 20.6% |
| Immigrants | Latin America | 0.0 /100 | #291 | Tragic 20.6% |
| Yaqui | 0.0 /100 | #292 | Tragic 20.7% |
| Immigrants | Senegal | 0.0 /100 | #293 | Tragic 20.7% |
| Immigrants | Bahamas | 0.0 /100 | #294 | Tragic 20.7% |
| Mexicans | 0.0 /100 | #295 | Tragic 20.7% |