Immigrants from Nepal vs Immigrants from Cabo Verde Seniors Poverty Over the Age of 65

COMPARE

Immigrants from Nepal
Race
Ancestry
AfghanAfricanAlaska NativeAlaskan AthabascanAlbanianAleutAlsatianAmericanApacheArabArapahoArgentineanArmenianAssyrian/Chaldean/SyriacAustralianAustrianBahamianBangladeshiBarbadianBasqueBelgianBelizeanBermudanBhutaneseBlackfeetBolivianBrazilianBritishBritish West IndianBulgarianBurmeseCajunCambodianCanadianCape VerdeanCarpatho RusynCelticCentral AmericanCentral American IndianCherokeeCheyenneChickasawChileanChineseChippewaChoctawColombianColvilleComancheCosta RicanCreeCreekCroatianCrowCubanCypriotCzechCzechoslovakianDanishDelawareDominicanDutchDutch West IndianEastern EuropeanEcuadorianEgyptianEnglishEstonianEthiopianEuropeanFijianFilipinoFinnishFrenchFrench American IndianFrench CanadianGermanGerman RussianGhanaianGreekGuamanian/ChamorroGuatemalanGuyaneseHaitianHmongHonduranHopiHoumaHungarianIcelanderIndian (Asian)IndonesianInupiatIranianIraqiIrishIroquoisIsraeliItalianJamaicanJapaneseJordanianKenyanKiowaKoreanLaotianLatvianLebaneseLiberianLithuanianLumbeeLuxembourgerMacedonianMalaysianMalteseMarshalleseMenomineeMexicanMexican American IndianMongolianMoroccanNative HawaiianNavajoNepaleseNew ZealanderNicaraguanNigerianNorthern EuropeanNorwegianOkinawanOsageOttawaPaiutePakistaniPalestinianPanamanianParaguayanPennsylvania GermanPeruvianPimaPolishPortuguesePotawatomiPuebloPuerto RicanPuget Sound SalishRomanianRussianSalvadoranSamoanScandinavianScotch-IrishScottishSeminoleSenegaleseSerbianShoshoneSierra LeoneanSiouxSlavicSlovakSloveneSomaliSouth AfricanSouth AmericanSouth American IndianSoviet UnionSpaniardSpanishSpanish AmericanSpanish American IndianSri LankanSubsaharan AfricanSudaneseSwedishSwissSyrianTaiwaneseThaiTlingit-HaidaTohono O'OdhamTonganTrinidadian and TobagonianTsimshianTurkishU.S. Virgin IslanderUgandanUkrainianUruguayanUteVenezuelanVietnameseWelshWest IndianYakamaYaquiYugoslavianYumanYup'ikZimbabwean
Immigration
NonimmigrantsImmigrantsAfghanistanAfricaAlbaniaArgentinaArmeniaAsiaAustraliaAustriaBahamasBangladeshBarbadosBelarusBelgiumBelizeBoliviaBosnia and HerzegovinaBrazilBulgariaBurma/MyanmarCambodiaCameroonCanadaCaribbeanCentral AmericaChileChinaColombiaCongoCosta RicaCroatiaCubaCzechoslovakiaDenmarkDominicaDominican RepublicEastern AfricaEastern AsiaEastern EuropeEcuadorEgyptEl SalvadorEnglandEritreaEthiopiaEuropeFijiFranceGermanyGhanaGreeceGrenadaGuatemalaGuyanaHaitiHondurasHong KongHungaryIndiaIndonesiaIranIraqIrelandIsraelItalyJamaicaJapanJordanKazakhstanKenyaKoreaKuwaitLaosLatin AmericaLatviaLebanonLiberiaLithuaniaMalaysiaMexicoMicronesiaMiddle AfricaMoldovaMoroccoNepalNetherlandsNicaraguaNigeriaNorth AmericaNorth MacedoniaNorthern AfricaNorthern EuropeNorwayOceaniaPakistanPanamaPeruPhilippinesPolandPortugalRomaniaRussiaSaudi ArabiaScotlandSenegalSerbiaSierra LeoneSingaporeSomaliaSouth AfricaSouth AmericaSouth Central AsiaSouth Eastern AsiaSouthern EuropeSpainSri LankaSt. Vincent and the GrenadinesSudanSwedenSwitzerlandSyriaTaiwanThailandTrinidad and TobagoTurkeyUgandaUkraineUruguayUzbekistanVenezuelaVietnamWest IndiesWestern AfricaWestern AsiaWestern EuropeYemenZaireZimbabweAzores
Immigrants from Cabo Verde
Race
Ancestry
AfghanAfricanAlaska NativeAlaskan AthabascanAlbanianAleutAlsatianAmericanApacheArabArapahoArgentineanArmenianAssyrian/Chaldean/SyriacAustralianAustrianBahamianBangladeshiBarbadianBasqueBelgianBelizeanBermudanBhutaneseBlackfeetBolivianBrazilianBritishBritish West IndianBulgarianBurmeseCajunCambodianCanadianCape VerdeanCarpatho RusynCelticCentral AmericanCentral American IndianCherokeeCheyenneChickasawChileanChineseChippewaChoctawColombianColvilleComancheCosta RicanCreeCreekCroatianCrowCubanCypriotCzechCzechoslovakianDanishDelawareDominicanDutchDutch West IndianEastern EuropeanEcuadorianEgyptianEnglishEstonianEthiopianEuropeanFijianFilipinoFinnishFrenchFrench American IndianFrench CanadianGermanGerman RussianGhanaianGreekGuamanian/ChamorroGuatemalanGuyaneseHaitianHmongHonduranHopiHoumaHungarianIcelanderIndian (Asian)IndonesianInupiatIranianIraqiIrishIroquoisIsraeliItalianJamaicanJapaneseJordanianKenyanKiowaKoreanLaotianLatvianLebaneseLiberianLithuanianLumbeeLuxembourgerMacedonianMalaysianMalteseMarshalleseMenomineeMexicanMexican American IndianMongolianMoroccanNative HawaiianNavajoNepaleseNew ZealanderNicaraguanNigerianNorthern EuropeanNorwegianOkinawanOsageOttawaPaiutePakistaniPalestinianPanamanianParaguayanPennsylvania GermanPeruvianPimaPolishPortuguesePotawatomiPuebloPuerto RicanPuget Sound SalishRomanianRussianSalvadoranSamoanScandinavianScotch-IrishScottishSeminoleSenegaleseSerbianShoshoneSierra LeoneanSiouxSlavicSlovakSloveneSomaliSouth AfricanSouth AmericanSouth American IndianSoviet UnionSpaniardSpanishSpanish AmericanSpanish American IndianSri LankanSubsaharan AfricanSudaneseSwedishSwissSyrianTaiwaneseThaiTlingit-HaidaTohono O'OdhamTonganTrinidadian and TobagonianTsimshianTurkishU.S. Virgin IslanderUgandanUkrainianUruguayanUteVenezuelanVietnameseWelshWest IndianYakamaYaquiYugoslavianYumanYup'ikZimbabwean
Immigration
NonimmigrantsImmigrantsAfghanistanAfricaAlbaniaArgentinaArmeniaAsiaAustraliaAustriaBahamasBangladeshBarbadosBelarusBelgiumBelizeBoliviaBosnia and HerzegovinaBrazilBulgariaBurma/MyanmarCabo VerdeCambodiaCameroonCanadaCaribbeanCentral AmericaChileChinaColombiaCongoCosta RicaCroatiaCubaCzechoslovakiaDenmarkDominicaDominican RepublicEastern AfricaEastern AsiaEastern EuropeEcuadorEgyptEl SalvadorEnglandEritreaEthiopiaEuropeFijiFranceGermanyGhanaGreeceGrenadaGuatemalaGuyanaHaitiHondurasHong KongHungaryIndiaIndonesiaIranIraqIrelandIsraelItalyJamaicaJapanJordanKazakhstanKenyaKoreaKuwaitLaosLatin AmericaLatviaLebanonLiberiaLithuaniaMalaysiaMexicoMicronesiaMiddle AfricaMoldovaMoroccoNetherlandsNicaraguaNigeriaNorth AmericaNorth MacedoniaNorthern AfricaNorthern EuropeNorwayOceaniaPakistanPanamaPeruPhilippinesPolandPortugalRomaniaRussiaSaudi ArabiaScotlandSenegalSerbiaSierra LeoneSingaporeSomaliaSouth AfricaSouth AmericaSouth Central AsiaSouth Eastern AsiaSouthern EuropeSpainSri LankaSt. Vincent and the GrenadinesSudanSwedenSwitzerlandSyriaTaiwanThailandTrinidad and TobagoTurkeyUgandaUkraineUruguayUzbekistanVenezuelaVietnamWest IndiesWestern AfricaWestern AsiaWestern EuropeYemenZaireZimbabweAzores
Seniors Poverty Over the Age of 65
Income
Poverty
Unemployment
Labor Participation
Family Structure
Vehicle Availability
Education Level
Disability

Seniors Poverty Over the Age of 65 Comparison

Immigrants from Nepal

Immigrants from Cabo Verde

Exceptional
Tragic
10.1%
SENIORS POVERTY OVER THE AGE OF 65
97.2/ 100
METRIC RATING
85th/ 347
METRIC RANK
16.2%
SENIORS POVERTY OVER THE AGE OF 65
0.0/ 100
METRIC RATING
336th/ 347
METRIC RANK

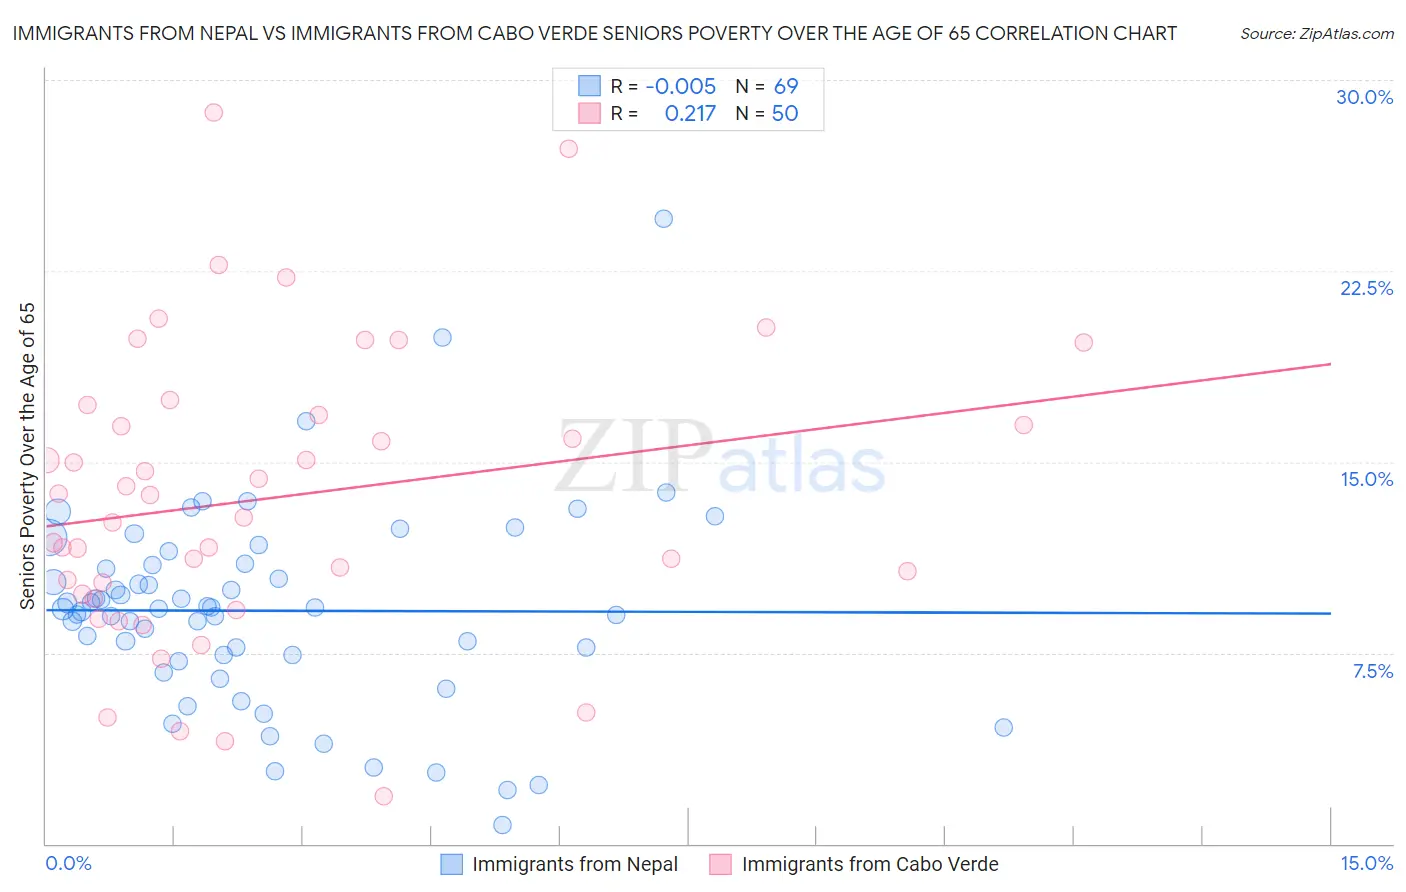
Immigrants from Nepal vs Immigrants from Cabo Verde Seniors Poverty Over the Age of 65 Correlation Chart

The statistical analysis conducted on geographies consisting of 186,290,028 people shows no correlation between the proportion of Immigrants from Nepal and poverty level among seniors over the age of 65 in the United States with a correlation coefficient (R) of -0.005 and weighted average of 10.1%. Similarly, the statistical analysis conducted on geographies consisting of 38,086,580 people shows a weak positive correlation between the proportion of Immigrants from Cabo Verde and poverty level among seniors over the age of 65 in the United States with a correlation coefficient (R) of 0.217 and weighted average of 16.2%, a difference of 60.8%.
Immigrants from Nepal vs Immigrants from Cabo Verde Seniors Poverty Over the Age of 65

Seniors Poverty Over the Age of 65 Correlation Summary

MeasurementImmigrants from NepalImmigrants from Cabo Verde
Minimum0.71%1.9%
Maximum24.6%28.7%
Range23.8%26.9%
Mean9.2%13.6%
Median9.2%13.3%
Interquartile 25% (IQ1)7.3%9.8%
Interquartile 75% (IQ3)11.0%16.9%
Interquartile Range (IQR)3.7%7.1%
Standard Deviation (Sample)3.9%5.7%
Standard Deviation (Population)3.9%5.7%

Similar Demographics by Seniors Poverty Over the Age of 65

Demographics Similar to Immigrants from Nepal by Seniors Poverty Over the Age of 65

In terms of seniors poverty over the age of 65, the demographic groups most similar to Immigrants from Nepal are Immigrants from Afghanistan (10.1%, a difference of 0.0%), Romanian (10.1%, a difference of 0.020%), Immigrants from Poland (10.1%, a difference of 0.030%), Burmese (10.1%, a difference of 0.040%), and Immigrants from Bolivia (10.1%, a difference of 0.060%).
DemographicsRating | RankSeniors Poverty Over the Age of 65
Whites/Caucasians
97.5
/100
|
#78
Exceptional
10.0%
Immigrants | Ireland
97.5
/100
|
#79
Exceptional
10.0%
Koreans
97.4
/100
|
#80
Exceptional
10.1%
Immigrants | Sri Lanka
97.3
/100
|
#81
Exceptional
10.1%
Immigrants | Bolivia
97.3
/100
|
#82
Exceptional
10.1%
Immigrants | Poland
97.2
/100
|
#83
Exceptional
10.1%
Immigrants | Afghanistan
97.2
/100
|
#84
Exceptional
10.1%
Immigrants | Nepal
97.2
/100
|
#85
Exceptional
10.1%
Romanians
97.2
/100
|
#86
Exceptional
10.1%
Burmese
97.2
/100
|
#87
Exceptional
10.1%
Jordanians
97.1
/100
|
#88
Exceptional
10.1%
Immigrants | Bulgaria
97.0
/100
|
#89
Exceptional
10.1%
Ukrainians
96.9
/100
|
#90
Exceptional
10.1%
Puget Sound Salish
96.9
/100
|
#91
Exceptional
10.1%
Immigrants | Singapore
96.9
/100
|
#92
Exceptional
10.1%

Demographics Similar to Immigrants from Cabo Verde by Seniors Poverty Over the Age of 65

In terms of seniors poverty over the age of 65, the demographic groups most similar to Immigrants from Cabo Verde are Cuban (16.1%, a difference of 0.57%), Immigrants from Nicaragua (15.9%, a difference of 1.8%), Immigrants from Caribbean (16.5%, a difference of 1.8%), Immigrants from Yemen (15.9%, a difference of 2.0%), and Immigrants from Grenada (15.8%, a difference of 2.4%).
DemographicsRating | RankSeniors Poverty Over the Age of 65
Immigrants | Dominica
0.0
/100
|
#329
Tragic
15.5%
Immigrants | St. Vincent and the Grenadines
0.0
/100
|
#330
Tragic
15.5%
British West Indians
0.0
/100
|
#331
Tragic
15.6%
Immigrants | Grenada
0.0
/100
|
#332
Tragic
15.8%
Immigrants | Yemen
0.0
/100
|
#333
Tragic
15.9%
Immigrants | Nicaragua
0.0
/100
|
#334
Tragic
15.9%
Cubans
0.0
/100
|
#335
Tragic
16.1%
Immigrants | Cabo Verde
0.0
/100
|
#336
Tragic
16.2%
Immigrants | Caribbean
0.0
/100
|
#337
Tragic
16.5%
Pueblo
0.0
/100
|
#338
Tragic
17.2%
Navajo
0.0
/100
|
#339
Tragic
17.5%
Hopi
0.0
/100
|
#340
Tragic
17.8%
Dominicans
0.0
/100
|
#341
Tragic
17.8%
Immigrants | Cuba
0.0
/100
|
#342
Tragic
17.9%
Lumbee
0.0
/100
|
#343
Tragic
18.1%