Immigrants from Morocco vs Immigrants from Nicaragua Single Father Poverty
COMPARE
Immigrants from Morocco
Immigrants from Nicaragua
Single Father Poverty
Single Father Poverty Comparison
Immigrants from Morocco
Immigrants from Nicaragua
16.3%
SINGLE FATHER POVERTY
50.7/ 100
METRIC RATING
171st/ 347
METRIC RANK
16.2%
SINGLE FATHER POVERTY
67.8/ 100
METRIC RATING
155th/ 347
METRIC RANK
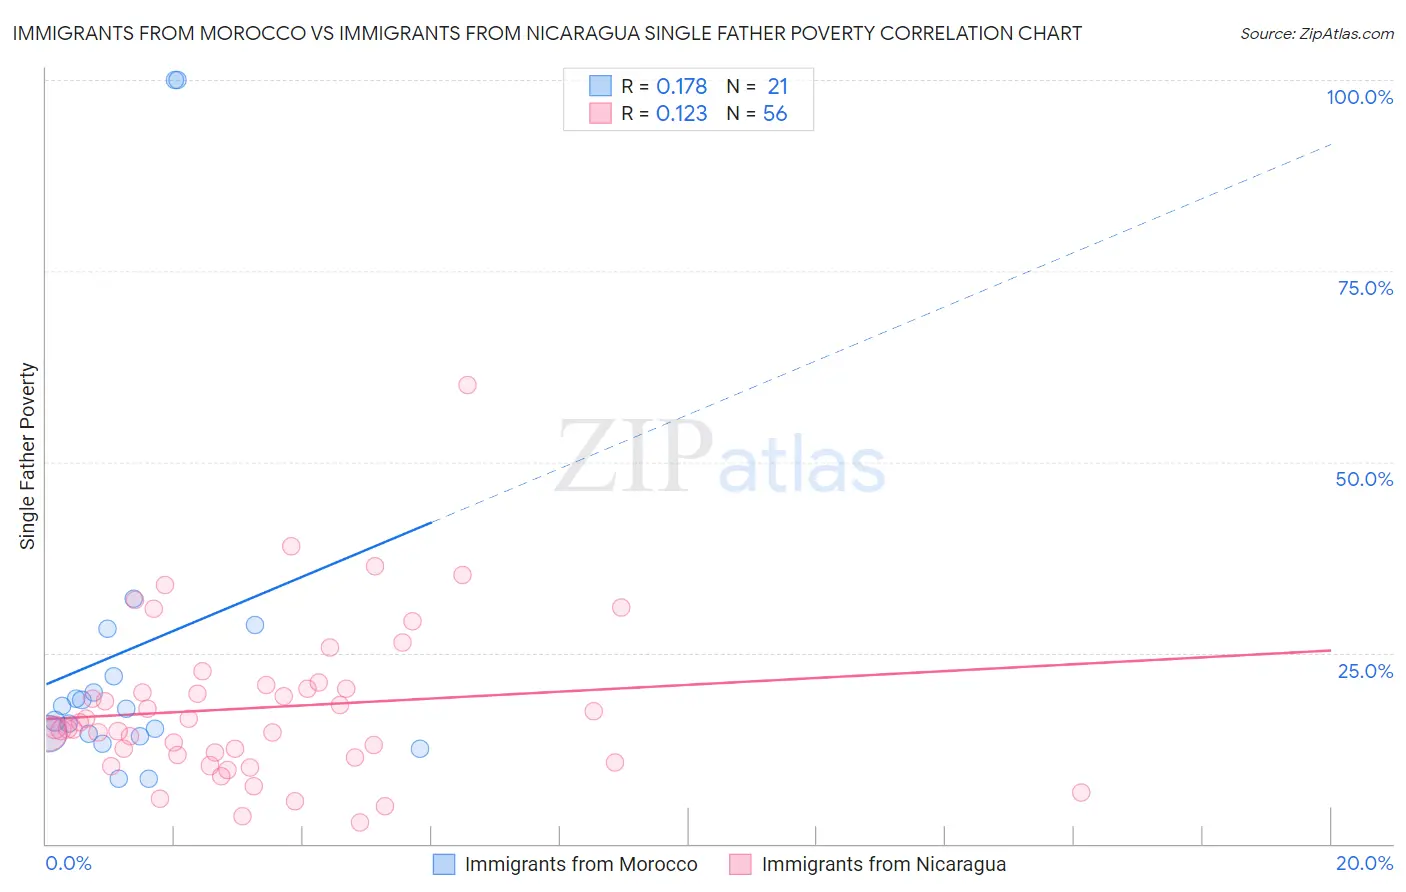
Immigrants from Morocco vs Immigrants from Nicaragua Single Father Poverty Correlation Chart
The statistical analysis conducted on geographies consisting of 153,611,026 people shows a poor positive correlation between the proportion of Immigrants from Morocco and poverty level among single fathers in the United States with a correlation coefficient (R) of 0.178 and weighted average of 16.3%. Similarly, the statistical analysis conducted on geographies consisting of 204,495,523 people shows a poor positive correlation between the proportion of Immigrants from Nicaragua and poverty level among single fathers in the United States with a correlation coefficient (R) of 0.123 and weighted average of 16.2%, a difference of 0.80%.
Single Father Poverty Correlation Summary
| Measurement | Immigrants from Morocco | Immigrants from Nicaragua |
| Minimum | 8.5% | 2.8% |
| Maximum | 100.0% | 60.0% |
| Range | 91.5% | 57.2% |
| Mean | 25.5% | 17.8% |
| Median | 17.7% | 15.2% |
| Interquartile 25% (IQ1) | 14.2% | 11.5% |
| Interquartile 75% (IQ3) | 25.0% | 20.6% |
| Interquartile Range (IQR) | 10.8% | 9.1% |
| Standard Deviation (Sample) | 25.5% | 10.3% |
| Standard Deviation (Population) | 24.9% | 10.2% |
Demographics Similar to Immigrants from Morocco and Immigrants from Nicaragua by Single Father Poverty
In terms of single father poverty, the demographic groups most similar to Immigrants from Morocco are Immigrants from Sierra Leone (16.3%, a difference of 0.030%), Immigrants from St. Vincent and the Grenadines (16.3%, a difference of 0.030%), Scandinavian (16.3%, a difference of 0.070%), Northern European (16.3%, a difference of 0.090%), and Costa Rican (16.3%, a difference of 0.13%). Similarly, the demographic groups most similar to Immigrants from Nicaragua are Immigrants from Jordan (16.2%, a difference of 0.090%), Mexican (16.1%, a difference of 0.12%), Immigrants from Israel (16.1%, a difference of 0.22%), Immigrants from Czechoslovakia (16.2%, a difference of 0.25%), and Portuguese (16.2%, a difference of 0.27%).
| Demographics | Rating | Rank | Single Father Poverty |
| Immigrants | Israel | 72.0 /100 | #153 | Good 16.1% |
| Mexicans | 70.1 /100 | #154 | Good 16.1% |
| Immigrants | Nicaragua | 67.8 /100 | #155 | Good 16.2% |
| Immigrants | Jordan | 66.0 /100 | #156 | Good 16.2% |
| Immigrants | Czechoslovakia | 62.8 /100 | #157 | Good 16.2% |
| Portuguese | 62.3 /100 | #158 | Good 16.2% |
| Belizeans | 59.9 /100 | #159 | Average 16.2% |
| Immigrants | Sudan | 59.8 /100 | #160 | Average 16.2% |
| Estonians | 56.7 /100 | #161 | Average 16.2% |
| Ugandans | 55.9 /100 | #162 | Average 16.3% |
| Immigrants | Costa Rica | 55.7 /100 | #163 | Average 16.3% |
| Guyanese | 55.2 /100 | #164 | Average 16.3% |
| Immigrants | Bangladesh | 55.1 /100 | #165 | Average 16.3% |
| Immigrants | Europe | 54.8 /100 | #166 | Average 16.3% |
| Yugoslavians | 53.9 /100 | #167 | Average 16.3% |
| Costa Ricans | 53.6 /100 | #168 | Average 16.3% |
| Northern Europeans | 52.8 /100 | #169 | Average 16.3% |
| Scandinavians | 52.3 /100 | #170 | Average 16.3% |
| Immigrants | Morocco | 50.7 /100 | #171 | Average 16.3% |
| Immigrants | Sierra Leone | 50.1 /100 | #172 | Average 16.3% |
| Immigrants | St. Vincent and the Grenadines | 50.0 /100 | #173 | Average 16.3% |